
Beneath your feet - Geological Map Search Tool. Brought to you by Geology Resources. Habitat-based cetacean density models for the U.S. Atlantic and Gulf of Mexico (2015 Version) Abstract Cetaceans are protected worldwide but vulnerable to incidental harm from an expanding array of human activities at sea.
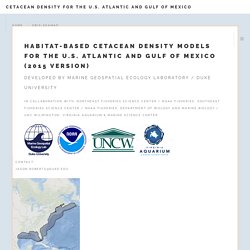
Managing potential hazards to these highly-mobile populations increasingly requires a detailed understanding of their seasonal distributions and habitats. Pursuant to the urgent need for this knowledge in U.S. waters of the western North Atlantic and Gulf of Mexico, we integrated aerial and shipboard cetacean surveys conducted by five scientific organizations over 23 years and linked them to environmental data relating to cetacean habitat, such as sea surface temperature and chlorophyll concentration, obtained from satellite remote sensing and ocean models. Using distance sampling methodology, we built statistical models of cetacean density—the number of individual animals found per square kilometer of area—from environmental variables for 26 species and 3 multi-species guilds, and produced maps showing average density across the modeled region.
International Trade Statistics Database. Marine Gravity from Satellite Altimetry. Data on slight variations of the pull of gravity over the oceans are recorded with satellite altimetry, and are then combined to map the seafloor globally.
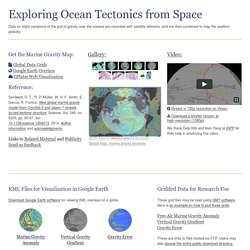
Get the Marine Gravity Map: Global Data Grids Google Earth Overlays GPlates Web Visualization Reference: Sandwell, D. Links to Related Material and Publicity. 10 Fuentes de datos GIS gratis: Los mejores datos globales raster y vectoriales. Map images - National Library of Scotland. Free mapping data will elevate flood risk knowledge. For the past 17 years we have been capturing LIDAR (Light Detection & Ranging) data in England.
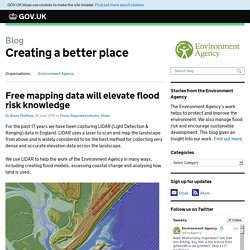
LIDAR uses a laser to scan and map the landscape from above and is widely considered to be the best method for collecting very dense and accurate elevation data across the landscape. We use LIDAR to help the work of the Environment Agency in many ways, including creating flood models, assessing coastal change and analysing how land is used. Direction générale des entreprises (DGE) Data products - Data products - EMODnet Bathymetry. Les prévisions océanographiques de référence sur data.shom.fr. Le SHOM est l’établissement public national ayant pour mission de fournir les prévisions décrivant les évolutions de l’environnement marin.
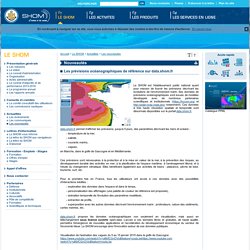
Ses données de prévisions océanographiques sont issues de modèles développés avec de nombreux partenaires scientifiques et institutionnels ( et notamment). Ces données à très haute résolution spatiale et temporelle sont désormais disponibles sur le portail data.shom.fr. data.shom.fr permet d’afficher les prévisions, jusqu’à 5 jours, des paramètres décrivant les mers et océans : - température de la mer, - salinité, - courants marins, - vagues, en Manche, dans le golfe de Gascogne et en Méditerranée. Ces prévisions sont nécessaires à la protection et à la mise en valeur de la mer, à la prévention des risques, au développement durable des activités en mer, à la planification de l’espace maritime, à l’aménagement littoral, et à l’étude du changement climatique.
MEOP-CTD in-situ data collection: a Southern ocean Marine-mammals calibrated sea water temperatures and salinities observations, December 2014 release. Open Data Catalog (Index) This catalog is created and maintained through the efforts of OpenGeoCode.Org and Crowdsourcing.
If you'd like to contribute, email your list of open data portals to: portal@opengeocode.org, or post the submission here: Download Catalog as CSV file (CC0) ISRIC SoilGrids1km visualisation and distribution website. Scottish independence referendum: final results in full. 10 Free GIS Data Sources: Best Global Raster and Vector Datasets - GIS Geography. In a perfect world, you’d be able to find all the free GIS data you need in a single website. Of course, it would have to be free, downloadable from an authoritative source.
…But well, you know the drill. The world’s not perfect, life’s not fair. SNAP: Data Downloads. SNAP data includes downscaled historically observed, modeled historical, as well as modeled projected data out to 2100 across several top ranked GCM's and scenarios (SRES or RCPs).
Data is produced on a project specific basis, but when time and feasibility allows, we try and extend analyses to the greatest spatial and temporal extent possible to allow the greatest applicability to other projects as well. In the broadest sense, our data extends from the mid–1800s to 2100, across multiple spatial extents including: Alaska, Alaska-Western Canada, Polar, and worldwide. The list of variables is always expanding, so please explore below to see what we currently have available. Natural Spaces - Scottish Natural Heritage. Apologies for any inconvenience, but we are having technical problems with the login and download functionality.

Our team is working on resolving this issue, please try again later. Natural Spaces provides an online data download facility giving access to a wide range of datasets including protected areas, habitats and species, landscape, open space and access. You can use your SNH account to access our data. If you wish, you can also create a direct connection to our OGC Web Map Services from within your desktop GIS application. Please take advantage of our RSS feeds to keep track of updates. Importing 100 years of climate change into R. This is a flashback post, I was working on species distribution shifts over the last 40 years last summer and recently Rémi Genevest contacted me asking me how I managed to import the CRU TS 1.2 dataset into R.
As always a more readable version of the code can be found here. At that time I used a not very elegant coding involving SpatialPixels and SpatilGridDataFrame, scrolling back to the question I asked to the R-sig-geo mailing list back then I stumbles across the answer from Robert Hijmans that I did not take into account at that time. Map Warper: Home. List of GIS data sources. This is a list of GIS data sources that provide information sets that can be used in geographic information systems (GIS) and spatial databases for purposes of geospatial analysis and cartographic mapping.
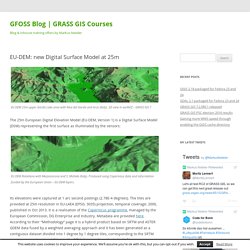
This list categorizes the sources by location of interest. Global[edit] Europe[edit] Canada[edit] Canada Regional[edit] United States[edit] United States Regional[edit] Global Forest Watch. Spatineo Directory - rapanui. Marine Regions. EU-DEM: new Digital Surface Model at 25m. EU DEM 25m upper Garda Lake area with Riva del Garda and Arco (Italy). 3D view in wxNVIZ – GRASS GIS 7 The 25m European Digital Elevation Model (EU-DEM, Version 1) is a Digital Surface Model (DSM) representing the first surface as illuminated by the sensors:
09/19 > BE Royaume-Uni 111 > Communication par lumière visible : après le Wi-Fi, le Li-Fi. Colloque 3D Caen. Hex Airbot. Safecast. Mapping Heats Up As Apple Buys Embark, Google Integrates Waze...What's Next? GPS : Le dessus des cartes. Uncharted Territory: The Power of Amateur Cartographers - Wired Science. In May 2013, Google’s vice president took to stage and announced that Google was aiming to build “a perfect map of the world.” An honorable notion with almost utopian connotations — and why shouldn’t it? After all, Google has been at the forefront of leading the biggest change to mapping since the 15th century, when maps went from manuscript to print. Now they’re online and taking advantage of satellite imagery, maps are more detailed, accurate and multi-dimensional than they’ve ever been, but could such a thing as the perfect map ever exist?
[partner id="wireduk"]History tells us no, and that we should be wary of anyone — any state, any organization or any company — that declares a wish to create one, says Jerry Brotton, Professor of Renaissance Studies at Queen Mary University London and author of A History of the World in Twelve Maps. Parcell'air. Le 22 Février dernier, au sein de la DGFiP, un groupe de travail « Cadastre » a réuni Directeurs de cette Administration et représentants syndicaux. A l’ordre du jour notamment, le dossier toujours brulant de la convergence entre PCI et BD-parcellaire, car « Il y a eu dans le passé beaucoup de querelles d’experts, et des compromis seront peut-être nécessaires de part et d’autre… « . Une fiche interne à la DGFiP, expose les nouvelles orientations et l’esprit qui anime désormais nos deux vénérables institutions, enlisées dans un conflit, qui même si le temps est élastique, s’est apparentée à une guerre médiévale.
Alpage : base publique. Cartographie : la révolution numérique. LE MONDE SCIENCE ET TECHNO | • Mis à jour le | David Larousserie L'époque change. Disparues les prises de bec dans un couple autour d'une carte routière. Global Roads Open Access Data Set (gROADS), v1: Global Roads. La géolocalisation, nouveau Graal des géants du Net. Crowdsourced Snow Avalanche Information. Plate-forme des données sur les risques globaux. Paris sous-surveillance - Cartographie collaborative et ressources sur la vidéo-surveillance. The dark side of data. A few weeks ago, Tom Slee published “Seeing Like a Geek,” a thoughtful article on the dark side of open data.
He starts with the story of a Dalit community in India, whose land was transferred to a group of higher cast Mudaliars through bureaucratic manipulation under the guise of standardizing and digitizing property records. While this sounds like a good idea, it gave a wealthier, more powerful group a chance to erase older, traditional records that hadn’t been properly codified.
One effect of passing laws requiring standardized, digital data is to marginalize all data that can’t be standardized or digitized, and to marginalize the people who don’t control the process of standardization. That’s a serious problem. It’s sad to see oppression and property theft riding in under the guise of transparency and openness. MIT geospatial.