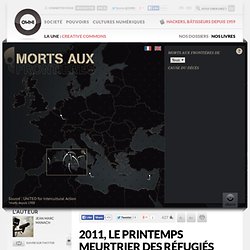

Datablog.owni.fr. 2011, le printemps meurtrier des réfugiés. Le nombre de migrants morts noyés dans la Méditerranée a dépassé, en 6 mois, le nombre de morts recensés les années précédentes. 2011 risque fort d'être l'année la plus meurtrière pour les réfugiés cherchant asile en Europe.

De janvier à juin, entre 1500 et 1800 migrants au moins sont morts en tentant de venir se réfugier en Europe, laissant augurer que l’année 2011 sera la plus mortelle pour les réfugiés. En 2006, 2000 morts avaient été recensés, pour toute l’année, et 1785 en 2007. Toutes les autres années, le nombre de morts répertoriés étaient inférieurs à 1500. Ces chiffres sont issus de la veille organisée par deux ONG, Fortress Europe et United qui, depuis des années, scrutent la presse et les rapports officiels ou émanant d’ONG afin de documenter ce qu’ils qualifient de “guerre aux migrants“. Depuis janvier, United a en effet recensé 1478 morts aux frontières, dont 1387 noyés en tentant de fuir la Tunisie ou la Libye, portant à 15 551 le nombre de morts recensés depuis 1993. [Infographie] Wikipedia, Amazon, YouTube, Twitter, Facebook, eBay: le comparatif des géants. Qu’arrive-t-il en 60 secondes sur le web ? Que se passe-t-il sur le web en 60 petites secondes ?

C’est la question a laquelle Shanghai Web Designers a tenté de répondre à travers une infographie basée sur diverses statistiques. On y apprend notamment qu’en une minute, 168 millions d’emails sont envoyés, 13 000 applications iPhone sont téléchargées, ou encore que 600 nouvelles vidéos apparaissent sur Youtube.
Bien qu’instructive, cette infographie risque de vous faire tourner la tête. Source : moderateur.blog.regionsjob.com. Infographie : Internet en 2015. 10 Best Data Visualization Projects of the Year – 2010. Data visualization and all things related continued its ascent this year with projects popping up all over the place.

Some were good, and a lot were not so good. More than anything, I noticed a huge wave of big infographics this year. It was amusing at first, but then it kind of got out of hand when online education and insurance sites started to game the system. Although it's died down a lot ever since the new Digg launched. That's what stuck out in my mind initially as I thought about the top projects of the year.
One of the major themes for 2010 was using data not just for analysis or business intelligence, but for telling stories. So here are the top 10 visualization projects of the year, listed from bottom to top. 10. Scott Manley of the Armagh Observatory visualized 30 years of asteroid discoveries. 9. Hannah Fairfield, former editor for The New York Times, and now graphics director for The Washington Post, had a look at gas prices versus miles driven per capita. 8. 50 Great Examples of Data Visualization.
Wrapping your brain around data online can be challenging, especially when dealing with huge volumes of information.

And trying to find related content can also be difficult, depending on what data you’re looking for. But data visualizations can make all of that much easier, allowing you to see the concepts that you’re learning about in a more interesting, and often more useful manner. Below are 50 of the best data visualizations and tools for creating your own visualizations out there, covering everything from Digg activity to network connectivity to what’s currently happening on Twitter. Music, Movies and Other Media Narratives 2.0 visualizes music. Liveplasma is a music and movie visualization app that aims to help you discover other musicians or movies you might enjoy. Tuneglue is another music visualization service.
MusicMap is similar to TuneGlue in its interface, but seems slightly more intuitive.