
21 Ways to Use Edmodo in your Classroom. Edmodo is a learning platform that is increasingly popular among teachers and educators.
It is really amazing the popularity Edmodo gained within a very short time since its introduction. In my past articles here in Educational Technology and Mobile Learning, I talked about the importance of Edmodo as a tool to flip your classroom, I also emphasized, in another post, on its use as a community building platform for your class where teachers and students get to share learning resources and interact with each others. Another good thing about Edmodo ,which I like so much, is its security. The data you upload there or the materials you share are safe and you can even customize your privacy settings to grant access to only certain people.
Edmodo is also one of the best means of teacher-student communication. Here is an awesome slide that features 21 ways to use Edmodo in your classroom. Scoop.it (scoopit) Brainstorm and mind map online. Infographics & Data Visualisation.
10 Awesome Free Tools To Make Infographics. Advertisement Who can resist a colourful, thoughtful venn diagram anyway?

In terms of blogging success, infographics are far more likely to be shared than your average blog post. This means more eyeballs on your important information, more people rallying for your cause, more backlinks and more visits to your blog. In short, a quality infographic done well could be what your blog needs right now. Designing An Infographic Some great tips for designing infographics: Keep it simple! Ideas for infographic formats include: Timelines;Flow charts;Annotated maps;Graphs;Venn diagrams;Size comparisons;Showing familiar objects or similar size or value. Here are some great tutorials on infographic creation: Creating Your Infographic Plan and research.If required, use free software to create simple graphs and visualisations of data.Use vector graphic software to bring these visualisations into the one graphic.
Free Online Tools For Creating Infographics Stat Planet Hohli Creately New York Times Many Eyes Wordle. 40 Useful and Creative Infographics. Six Revisions Menu Main Categories CSS HTML JavaScript Web Design WordPress Web Development Design Inspiration UX Design UI Design Freebies Tutorials Tools Links About Contact Advertise RSS Twitter Facebook 40 Useful and Creative Infographics By Jacob Gube Information graphics (or infographics) are graphical depictions of data and information.
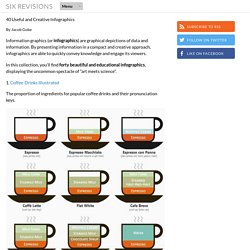
In this collection, you’ll find forty beautiful and educational infographics, displaying the uncommon spectacle of "art meets science". 1. The proportion of ingredients for popular coffee drinks and their pronunciation keys. 2. This infographic showcases the history of the Swine Flu, starting from 1976. Data Visualization, Information Design and Infographics. Infographics. Glogster - join the visual communication network. Share Ideas that matter. 20 BYOD Resources For The 21st Century School.