
Graphviz & MediaWiki. Garphviz Examples. Ajax/Graphviz. Ajax/Graphviz. Génération de graphes avec GraphViz. La production de certaines applications exige de pouvoir générer des graphes au sens recherche opérationelle du terme.
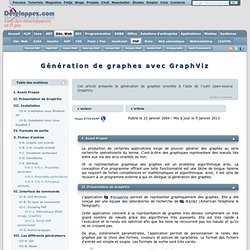
C'est-à-dire des graphiques représentant des noeuds liés entre eux via des arcs orientés ou non. Or la représentation graphique des graphes est un problème algorithmique ardu. La conception d'un programme offrant une telle fonctionnalité est une tâche de longue haleine qui requiert de fortes compétences en mathématiques et algorithmique. Ainsi, il est utile de recourir à un programme externe à qui on délègue la génération des graphes. L'application GraphViz permet de représenter graphiquement des graphes. AT&T (American Telephone & Telegraph). Cette application convient à la représentation de graphes très denses comprenant un très grand nombre de nœuds grâce des algorithmes très puissants.
De plus, entièrement paramétrable, l'application permet de personnaliser le rendu des graphes par le choix des formes, couleurs et polices de caractères. Agrandir cet aperçus... III-A. <? Graphviz. Graphviz. The DOT Language. The following is an abstract grammar defining the DOT language.
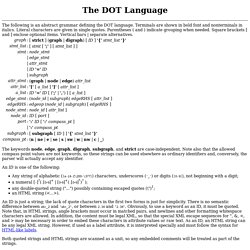
Terminals are shown in bold font and nonterminals in italics. Literal characters are given in single quotes. Parentheses ( and ) indicate grouping when needed. Square brackets [ and ] enclose optional items. Vertical bars | separate alternatives. The keywords node, edge, graph, digraph, subgraph, and strict are case-independent. An ID is one of the following: An ID is just a string; the lack of quote characters in the first two forms is just for simplicity. Both quoted strings and HTML strings are scanned as a unit, so any embedded comments will be treated as part of the strings. An edgeop is -> in directed graphs and -- in undirected graphs. The language supports C++-style comments: /* */ and //. Semicolons and commas aid readability but are not required. Subgraphs and Clusters Subgraphs play three roles in Graphviz. Is equivalent to In the second role, a subgraph can provide a context for setting attributes.
Command-line Usage. Output Formats. These formats produce output in the dot language.
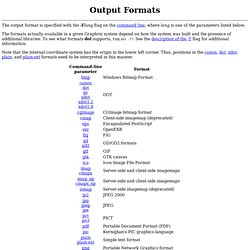
Using canon produces a prettyprinted version of the input, with no layout performed. The dot option corresponds to attributed dot output, and is the default output format. It reproduces the input, along with layout information for the graph. In particular, a bb attribute is attached to the graph, specifying the bounding box of the drawing. If the graph has a label, its position is specified by the lp attribute.
Each node gets pos, width and height attributes. Every edge is assigned a pos attribute, and if the edge has a label, the label position is given in lp. The xdot format extends the dot format by providing much more detailed information about how graph components are drawn. The format is fluid; comments and suggestions for better representations are welcome. Additional drawing attributes can appear on nodes, edges, clusters and on the graph itself. With version 1.4 of xdot, color strings may now encode linear and radial gradients. Main Page. UML activity diagrams with Graphviz « Geschreibsel.
Activity diagrams are somewhat doable with Graphviz, they just don’t look very nice, some straight edges would be great.
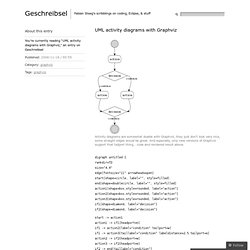
And especially, only new versions of Graphviz support that tailport thing… code and rendered result above. digraph untitled { rankdir=TD size="4,4" edge[fontsize="11" arrowhead=open] start[shape=circle, label="", style=filled] end[shape=doublecircle, label="", style=filled] action1[shape=box,style=rounded, label="action"] action2[shape=box,style=rounded, label="action"] action3[shape=box,style=rounded, label="action"] if1[shape=diamond, label="decision"] if2[shape=diamond, label="decision"] start -> action1 action1 -> if1[headport=n] if1 -> action2[label="condition" tailport=w] if1 -> action3[taillabel="condition" labeldistance=2.5 tailport=e] action2 -> if2[headport=w] action3 -> if2[headport=e] if2 -> end[taillabel="condition"] } Like this: Like Loading...
Data Mining / Metadata Mining. Sequence Diagram & UML. WebSequenceDiagrams.com - Draw and Edit Sequence Diagrams in seconds. Gephi - The Open Graph Viz Platform.