
Data Maps. Maps That Explain The World. Using TileMill's raster-colorizer. Terrain maps are awesome, but creating them has been at best a complicated six-step process.
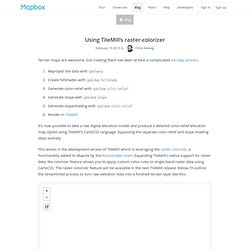
Reproject the data with gdalwarpCreate hillshades with gdaldem hillshadeGenerate color-relief with gdaldem color-reliefGenerate slope with gdaldem slopeGenerate slopeshading with gdaldem color-reliefRender in TileMill It’s now possible to take a raw digital elevation model and produce a detailed color-relief elevation map styled using TileMill’s CartoCSS language, bypassing the separate color-relief and slope shading steps entirely. The Pith of Performance: Going Beyond Florence Nightingale's Data Diagram: Did Flo Blow It with Wedges? Richer Customization with MapBox Custom Styles.
We’ve just relaunched one of MapBox’s most powerful features: custom styles for MapBox Streets.
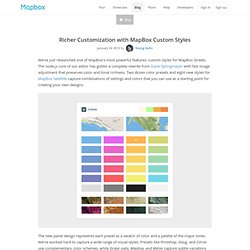
The node.js core of our editor has gotten a complete rewrite from Dane Springmeyer with fast image adjustment that preserves color and tonal richness. Two dozen color presets and eight new styles for MapBox Satellite capture combinations of settings and colors that you can use as a starting point for creating your own designs. The new panel design represents each preset as a swatch of color and a palette of the major tones. We’ve worked hard to capture a wide range of visual styles. Do You Find Yourself Falling for These 12 Familiar Myths about Clutter? « The Happiness Project. Map internationalization. National Forum on Education Statistics. OpenStreetMap Data. 2011 Census Open Atlas Project. This month has seen the release of the 2011 census data for England and Wales at Output Area Level.
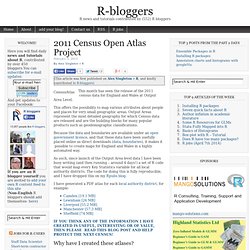
This offers the possibility to map various attributes about people and places for very small geographic areas. Output Areas represent the most detailed geography for which Census data are released and are the building blocks for many popular products such as geodemographic classifications. Because the data and boundaries are available under an open government licence, and that these data have been usefully placed online as direct downloads (data, boundaries), it makes it possible to create maps for England and Wales in a highly automated way.
As such, since launch of the Output Area level data I have been busy writing (and then running – around 4 days!) A set of R code that would map every Key Statistics variable for all local authority districts. I have generated a PDF atlas for each local authority district, for example: About Multilingual Maps Test. [To Map] This is a demo site.
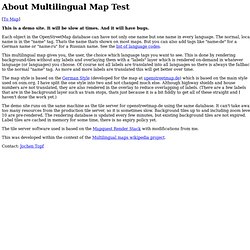
It will be slow at times. DoD, VA to accelerate EHR integration. Whereas the Defense and Veterans Affairs (VA) departments are working toward a joint iEHR that would, come 2017, wrap all patient data into a single record accessible to clinicians in both departments, U.S.

Defense Secretary Leon Panetta and VA’s Secretary Eric Shinseki pushed their staffs to accelerate data exchange and interoperability where they can now, rather than waiting. OpenStreetMap on the Wikimedia Toolservers. The Corkscrew Lines: Video Vault...Oh My Lords!...Hellfire! Submarine Cable Map. A New Editor for OpenStreetMap: iD. Today we are announcing the launch of ideditor.com, home of the web-based OpenStreetMap editor iD currently in Alpha phase.
This launch marks our stepped up involvement in the development of this editor. iD is designed to help create an even better, more current OpenStreetMap by lowering the threshold of entry to mapping with a straightforward, in-browser editing experience. Funded by a grant from the Knight Foundation, we have joined forces with Richard Fairhurst, the author of OpenStreetMap’s current web-based editor Potlatch 2. Earlier this week, the Alpha 1 version of iD was released. iD is entirely developed in the open: visit ideditor.com to learn how to test drive iD or contribute to its development. DRM be damned: How to protect your Amazon e-books from being deleted.
If you buy e-books from Amazon and want to engage in a bit of digital civil disobedience—by stripping the files’ DRM and making sure that Amazon can’t deny you access—we’re about to show you how.

Yes, many parts of the Internet have known about this technique for some time now, but we feel that it bears mentioning again here. Over the past week, the tech world has been abuzz with news that—surprise, surprise—Amazon can remotely wipe any Kindle, at any time, for effectively any reason. Asdfree by anthony damico. Visualization spectrum. A handful of experts weighed in on visualization as a spectrum rather than an unyielding tool.
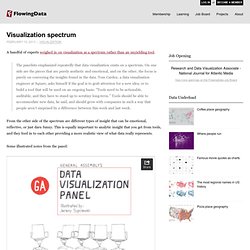
The panelists emphasized repeatedly that data visualization exists on a spectrum. On one side are the pieces that are purely aesthetic and emotional, and on the other, the focus is purely on conveying the insights found in the data. Tom Carden, a data visualization engineer at Square, asks himself if the goal is to grab attention for a new idea, or to build a tool that will be used on an ongoing basis: "Tools need to be actionable, auditable, and they have to stand up to scrutiny long-term. " Tools should be able to accommodate new data, he said, and should grow with companies in such a way that people aren’t surprised by a difference between this week and last week.
From the other side of the spectrum are different types of insight that can be emotional, reflective, or just darn funny. Some illustrated notes from the panel: Making Maps for Print Using QGIS. Free e-book on Data Science with R. Shiny 0.4.0 now available. Shiny version 0.4.0 is now available on CRAN.
The most visible change is that the API has been slightly simplified. Your existing code will continue to work, although Shiny will print messages about how to migrate your code. Migration should be straightforward, as described below. It will take a bit of work to switch to the new API, but we think it’s worth it in the long run, because the new interface is somewhat simpler, and because it offers a better mapping between function names and reactive programming concepts. Type Fun01. Get JSON from Excel using Python, xlrd. Powering interactive news applications off flat files rather than a call to a database server is an option worth considering.

Cutting a production database and data access layer out of the mix eliminates a whole slice of complexity and trims development time. Flat files aren’t right for every situation, but for small apps they’re often all you need. These days, most of the apps I help build at Gannett Digital consume JSON. Tableau Tip: Embedding dashboards from multiple, disparate workbooks into a single workbook. Here’s the situation: You have several people creating their own dashboards in separate workbooks Your boss doesn’t want to open all of the dashboards separately You need all of these diverse dashboards in a single dashboard The solution is way easier than you think. The Pith of Performance: Extracting the Epidemic Model: Going Beyond Florence Nightingale Part II.
This is the second of a two part reexamination of Florence Nightingale's data visualization based on her innovative cam diagrams (my term) shown in Figure 1. Figure 1. Nightingale's original cam diagrams (click to enlarge) Recap In Part I, I showed that FN applied sectoral areas, rather than a pie chart or conventional histogram, to reduce the visual impact of highly variable zymotic disease data from the Crimean War. MediSafe App Makes Sure You Take Your Pills on Time.
Keeping up with when to take different medicines can be a chore, especially if you need to take something at the same time everyday. Enter MediSafe, a virtual pillbox that can remind you to take medicines at the right time. If you’re responsible for someone -– for instance a child or elderly parent -– then you can also track their medications. Every Recorded Meteorite Impact on Earth.
Ramon Martinez of Health Intelligence created this viz displaying every registered meteorite that has impacted on Earth. Edit feature properties directly from the map. Want to make sliding ladder for library shelving : General Woodworking. How to Build a Library Ladder. A library ladder is a beautiful addition to an extensive book collection. ANDREW ZOLNAI BLOG.
Multilingual Maps Test. Joto/MapQuest-Render-Stack. Multilingual maps Wikipedia project. R scripts for analyzing survey data. Another site pops up with open code for analyzing public survey data: It will be interesting to see whether this gets used by the general public--given the growing trend of data journalism and so forth--versus academics. It is a useful resource for both. To leave a comment for the author, please follow the link and comment on his blog: The Data Monkey. R-bloggers.com offers daily e-mail updates about R news and tutorials on topics such as: visualization (ggplot2, Boxplots, maps, animation), programming (RStudio, Sweave, LaTeX, SQL, Eclipse, git, hadoop, Web Scraping) statistics (regression, PCA, time series, trading) and more... The Best Way to Give Honest Feedback to Your Boss. Aluminium Rail for Shelf Ladders with Shafting Hooks - 3m - Rails & Brackets - Shelf Ladders - Ladders By Type Ladderstore.com.
Malaria Consortium - Malaria Consortium. Mapping Tweets in Africa. The world's rudest place names. Vaguely Rude. Add context and custom content to your maps with our publishing templates.