
Www.cs.le.ac.uk/people/rh122/papers/2006/Hec06Nutshell.pdf. People.mozilla.com/~ydelendik/pdfjs-ttf-2012.pdf. 1.6. igraph_layout_reingold_tilford — Reingold-Tilford layout for tree graphs. 1.6. igraph_layout_reingold_tilford — Reingold-Tilford layout for tree graphs int igraph_layout_reingold_tilford(const igraph_t *graph, igraph_matrix_t *res, long int root); Arranges the nodes in a tree where the given node is used as the root.

The tree is directed downwards and the parents are centered above its children. For the exact algorithm, see: Epress.lib.uts.edu.au/dspace/bitstream/handle/2100/315/06Chap5toChap6.pdf?sequence=6. Km.aifb.kit.edu/ws/semsearch10/Files/umass.pdf. Terrierteam.dcs.gla.ac.uk/publications/lacour08ecir.pdf. Algorithms » Probabilistic Graphical Models. Pdf.aminer.org/000/560/757/d_mapping_with_semantic_knowledge.pdf. Www.image.ece.ntua.gr/papers/602.pdf. Cloud.pubs.dbs.uni-leipzig.de/sites/cloud.pubs.dbs.uni-leipzig.de/files/Reed2009BuildingaHighLevelDataowSystemontopofMapReduce.pdf. Web.engr.oregonstate.edu/~tgd/dissertations/keiser-ms-thesis.pdf. Pdf/1209.4523v1.pdf. Latent semantic analysis. Latent semantic analysis (LSA) is a technique in natural language processing, in particular in vectorial semantics, of analyzing relationships between a set of documents and the terms they contain by producing a set of concepts related to the documents and terms.

LSA assumes that words that are close in meaning will occur in similar pieces of text. A matrix containing word counts per paragraph (rows represent unique words and columns represent each paragraph) is constructed from a large piece of text and a mathematical technique called singular value decomposition (SVD) is used to reduce the number of columns while preserving the similarity structure among rows. Words are then compared by taking the cosine of the angle between the two vectors formed by any two rows. Values close to 1 represent very similar words while values close to 0 represent very dissimilar words.[1] Overview[edit] Occurrence matrix[edit] Rank lowering[edit] Derivation[edit] Let be a matrix where element in document ). Sigmoid function. Other examples of similar shapes include the Gompertz curve (used in modeling systems that saturate at large values of t) and the ogee curve (used in the spillway of some dams).

A wide variety of sigmoid functions have been used as the activation function of artificial neurons, including the logistic and hyperbolic tangent functions. Sigmoid curves are also common in statistics as cumulative distribution functions, such as the integrals of the logistic distribution, the normal distribution, and Student's t probability density functions. Definition[edit] A sigmoid function is a bounded differentiable real function that is defined for all real input values and has a positive derivative at each point.[1] Properties[edit] In general, a sigmoid function is real-valued and differentiable, having either a non-negative or non-positive first derivative[citation needed] which is bell shaped.
I build High Availability Platforms so Cloud is not for me. Ever since someone first tried to represent the idea of packet switched network that was resilient to failure they probably used a picture of a cloud.

Cisco’s official iconography for such a network is a cloud. It has been taken for granted for quite some time that if you throw a TCP packet at the Internet somehow it’ll get there and you don’t have to worry about it. Back before some Cloud Evangelists I’ve met were even old enough to buy a drink we had SETI which could leverage distributed computing that was available on demand and was just ‘out there somewhere’ it’s not new.
So now Cloud is synonymous with computing platforms that offer high availability, scalability and are resilient but the truth of the matter is that there aren’t. Cloud is great for people that want easy scalability, easy resilience and easy peace of mind. Here’s a very very brief list of the things that can wrong with an inbound request to your platform; Show.cgi (application/pdf Object) Concurrent Programming for Scalable Web Architectures. v14-25.pdf (application/pdf Object) EACL-2009-Apidianaki.pdf (application/pdf Object) LDIF – Linked Data Integration Framework. Orion: A System for Modeling, Transformation and Visualization of Multidimensional Heterogeneous Networks.
Contextual_Network_Graphs.pdf (application/pdf Object) The Use of Fuzzy Cognitive Maps in Modeling Systems. BibTeX @INPROCEEDINGS{Stylios97theuse, author = {Chrysostomos D.

Stylios and Voula C. Georgopoulos and Peter P. Groumpos}, title = {The Use of Fuzzy Cognitive Maps in Modeling Systems}, booktitle = {Proceeding of 5th IEEE Mediterranean Conference on Control and Systems, Paphos}, year = {1997}} Bookmark OpenURL Abstract This paper investigates a new theory, Fuzzy Cognitive Map (FCM) Theory, and its implementation in modeling systems. Citations. Visualizious: Visualizing Social Indexing. Visualizious Visualizious is a research project about social indexing (a.k.a. social tagging), information retrieval and visualization.
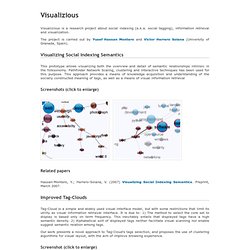
The project is carried out by Yusef Hassan Montero and Víctor Herrero Solana (University of Granada, Spain). Visualizing Social Indexing Semantics This prototype allows visualizing both the overview and detail of semantic relationships intrinsic in the folksonomy. Pathfinder Network Scaling, clustering and interactive techniques has been used for this purpose. Screenshots (click to enlarge) Related papers. SasaNesic.pdf (application/pdf Object) PubMed Central, Figure 1: AMIA Annu Symp Proc. 2003; 2003: 21–25. Making Unstructured Data Actionable in Display. I wrote recently about the new era of display marketing, and how real time bidding and other advances are bringing the precision and performance of search advertising to display.

Well…a new era of unstructured data is also upon us. A widely cited 2011 IDC study found that the amount of data in the world is now doubling every 2 years. This trend is especially apparent in marketing, as massive amounts of data are being created by ever-increasing numbers of search queries, SKU views, social signals, page visits, and more. Unstructured Data Volumes Exploding Traditional paradigms for managing data are struggling under this tsunami. AdExchanger.com recently quoted John Iwata of IBM as stating that 80% this data is “unstructured”. Eigenvalues and eigenvectors. In this shear mapping the red arrow changes direction but the blue arrow does not.
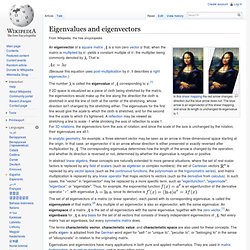
The blue arrow is an eigenvector of this shear mapping, and since its length is unchanged its eigenvalue is 1. Dig.csail.mit.edu/2007/Papers/AIMagazine/fractal-paper.pdf. Www-ags.dfki.uni-sb.de/~klusch/i2s/SMR2_mdsm.pdf. Markov blanket. In a Bayesian network, the Markov blanket of node A includes its parents, children and the other parents of all of its children. in a Bayesian network is the set of nodes composed of 's parents, its children, and its children's other parents.

Support vector machine. In machine learning, support vector machines (SVMs, also support vector networks[1]) are supervised learning models with associated learning algorithms that analyze data and recognize patterns, used for classification and regression analysis.
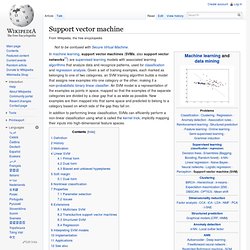
Given a set of training examples, each marked as belonging to one of two categories, an SVM training algorithm builds a model that assigns new examples into one category or the other, making it a non-probabilistic binary linear classifier. An SVM model is a representation of the examples as points in space, mapped so that the examples of the separate categories are divided by a clear gap that is as wide as possible. New examples are then mapped into that same space and predicted to belong to a category based on which side of the gap they fall on. Definition[edit] Whereas the original problem may be stated in a finite dimensional space, it often happens that the sets to discriminate are not linearly separable in that space.
Note that if. Perceptron. The perceptron algorithm was invented in 1957 at the Cornell Aeronautical Laboratory by Frank Rosenblatt.[1] Definition[edit] The perceptron is a binary classifier which maps its input (a real-valued vector) to an output value (a single binary value): where is a vector of real-valued weights, is the dot product (which here computes a weighted sum), and is the 'bias', a constant term that does not depend on any input value. The value of. Practical Machine Learning in Python. Scribd. Self-Improving Bayesian Sentiment Analysis for Twitter. That’s quite the mouthful. Let me start with a huge caveat: I’m not an expert on this, and much of it may be incorrect. I studied Bayesian statistics about fifteen years ago in university, but have no recollection of it (that sounds a bit like Bill Clinton: “I experimented with statistics but didn’t inhale the knowledge”).
Even so, given the increasing quantity of real-time content on the Internet, I find the automated analysis of it fascinating, and hope that something in this post might pique your interest. Naive Bayes classifier Bayesian probability, and in particular the Naïve Bayes classifier, is successfully used in many parts of the web, from IMDB ratings to spam filters. The classifier examines the independent features of an item, and compares those against the features (and classification) of previous items to deduce the likely classification of the new item. It is ‘naïve’ because the features are assessed independently. 4 legs65kg weight60cm height DogHumanDog Classifying Sentiment. Multi-agent ordering « Antimatroid, The. Given a set of agents and a set of entities , agents independently provide preferences between different pairs of entities for a subset of the possible. Wmatrix corpus analysis and comparison tool. Wmatrix is a software tool for corpus analysis and comparison.
It provides a web interface to the USAS and CLAWS corpus annotation tools, and standard corpus linguistic methodologies such as frequency lists and concordances. It also extends the keywords method to key grammatical categories and key semantic domains. Wmatrix allows the user to run these tools via a web browser such as Chrome, Firefox or Internet Explorer, and so will run on any computer (Mac, Windows, Linux, Unix) with a web browser and a network connection. Wmatrix was initially developed by Paul Rayson in the REVERE project, extended and applied to corpus linguistics during PhD work and is still being updated regularly. Earlier versions were available for Unix via terminal-based command line access (tmatrix) and Unix via Xwindows (Xmatrix), but these only offer retrieval of text pre-annotated with USAS and CLAWS.