
Data visualization - Wikipedia. Creation and study of the visual representation of data Data visualization is both an art and a science.[2] It is viewed as a branch of descriptive statistics by some, but also as a grounded theory development tool by others.
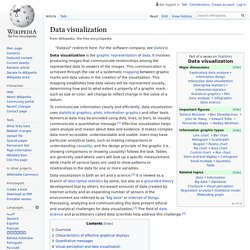
Increased amounts of data created by Internet activity and an expanding number of sensors in the environment are referred to as "big data" or Internet of things. Processing, analyzing and communicating this data present ethical and analytical challenges for data visualization.[3] The field of data science and practitioners called data scientists help address this challenge.[4] Overview[edit] Data visualization is one of the steps in analyzing data and presenting it to users.
Data visualization refers to the techniques used to communicate data or information by encoding it as visual objects (e.g., points, lines or bars) contained in graphics. Indeed, Fernanda Viegas and Martin M. Characteristics of effective graphical displays[edit] John Tukey[8] Graphics reveal data. Nik's Learning Technology Blog: Creating engagement through interactive infographics.
I’ve been a long term advocate of the use of infographics in education and especially enjoy thinking of ways that students can be encouraged to engage with and question the content as well as create their own graphics, so when I rediscovered Visme.co I was really delighted to find the tool that I once thought was a PowerPoint substitute for creating online presentations had turned into an awesome interactive infographic creator.

What’s so impressive about Visme? I’ve used quite a few infographic creation tools and most are either template based or they have a library of assets which you can drag and drop to construct your own layouts. Visme.co offers a combination of both these options along with the possibility to animate the elements within the graphic, drop in your own images or online videos and also embed html elements such as polls and quizzes into the graphic. How to use Visme When you go to the Visme.co dashboard you get three main options.
What I like about it Related links: Kid Librarian - Website Evaluation. DocentEDU 101. The best stats you've ever seen - Hans Rosling. Data, Information, Knowledge, & Wisdom. By Gene Bellinger, Durval Castro, Anthony Mills There is probably no segment of activity in the world attracting as much attention at present as that of knowledge management.
Yet as I entered this arena of activity I quickly found there didn't seem to be a wealth of sources that seemed to make sense in terms of defining what knowledge actually was, and how was it differentiated from data, information, and wisdom. What follows is the current level of understanding I have been able to piece together regarding data, information, knowledge, and wisdom. I figured to understand one of them I had to understand all of them. According to Russell Ackoff, a systems theorist and professor of organizational change, the content of the human mind can be classified into five categories: Ackoff indicates that the first four categories relate to the past; they deal with what has been or what is known.
A further elaboration of Ackoff's definitions follows: Data... data is raw. The Art of Data Visualization. DRIVING QUESTION. TeenTech research & IL resources. Backup of FINAL CULMINATING TASK C2. Analyzing Data Worksheet. Analyze surveys YELL. $cle 2 Final Task Teacher. FINAL CULMINATING TASK C2. Cycle 2 Final Task Teacher. Vision. Reflection Questions. Planning Pages .pdf. PERSONAL QUESTION NEED TO KNOW. ID Topics. Cycle 2 Final Task Teacher. Brainstorming Activities. Evaluating info. <div class="alert alert-error">We notice your browser has JavaScript disabled.
Please enable JavaScript for the full SchoolTube experience and to avoid page load errors. </div> Search Results for "visual storytelling"