
Calls to name and rate heatwaves to save lives as they become more frequent and severe. Giving heatwaves names and strength ratings, as for hurricanes, cyclones and typhoons, could help people understand how dangerous they are.

Large parts of the world — including in Australia — have seen fast-worsening heatwaves in recent years. And in the US, more people die each year from heatwaves than from storms and floods. “People do not understand this risk and we need to change that,” said Kathy Baughman McLeod, director of the Adrienne Arsht-Rockefeller Foundation Resilience Center in the US, which works to cut climate change, migration and security risks. With 2020 set to be one of the hottest years on record, in a long string of them, “extreme heat is or will be felt by everyone, everywhere, at some point. We have to build awareness to this invisible threat,” she told an online event. Heat deaths can occur from dehydration, heatstroke, kidney failure or as existing health problems are aggravated*, the World Health Organization says.
A report published on Monday by the U.S. 2. 54.4C recorded during heatwave in Death Valley. One of the hottest air temperatures recorded anywhere on Earth in at least a century, and possibly ever, was reached on Sunday afternoon at Death Valley in California’s Mojave Desert in the US, where it soared to 54.4C.
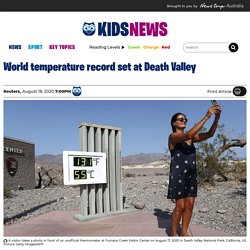
An automated observation system run by the U.S. National Weather Service in the valley’s sparsely* populated Furnace Creek reported the record at 3.41pm at the crest* of an extreme heatwave, a more frequent occurrence due to climate change. It was a dry heat: Humidity fell to 7 per cent. Australia Institute study of BOM weather data finds Australia’s summers longer and winters shorter. Australian summers are getting longer and winters shorter, according to a new study of two decades worth of Bureau of Meteorology* data.
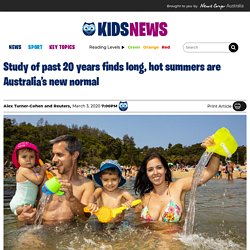
Our summers are now twice as long as our winters as climate change has increased temperatures since the middle of last century. The report by the Australia Institute, a Canberra-based research group, compared data from the past 20 years with mid-20th century benchmarks* of temperatures at the calendar start of seasons in temperate* and subtropical* parts of the country. Over the last two decades, summer across most of Australia has been on average one month (31 days) longer than half a century ago, while winter has shortened by an average three weeks (23 days). Over the past five years Australian summers were on average 50 per cent longer than they were in the mid-20th century based on temperature readings. The report was released as Australia counts the cost of a devastating and lengthy bushfire season that burned nearly 12 million hectares of bushland.
Earth has hottest June on record with weather and climate scientists predicting July 2019 to be hottest month ever. Tigers are eating dinner that’s been frozen in giant ice blocks, bears are slurping iced watermelon and pandas are being encouraged to sit still and stay cool in special airconditioned caves as Europe suffers through the latest in a summer of record-breaking heatwaves.

Earth has just experienced its hottest June on record but climate scientists are predicting July will be even hotter. And though Australia is in the middle of winter, the Bureau of Meteorology* (BOM) issued a bushfire warning for parts of NSW earlier this week with July temperatures set to come close to breaking records. Zookeepers at Pairi Daiza Zoo in western Belgium had to use their imagination to keep the tigers, bears and pandas safe in the heat as the country hit 39.9C on Wednesday. Kids explain why rain isn't the same. Monsoon rains spark explosion of life in Kakadu.
What's in a year? (SEASONS) Climate statistics for Australian locations. Herald Sun. What are the major climate zones of the world? - Fun Kids - the UK's children's radio station. Climate is all about patterns of weather.
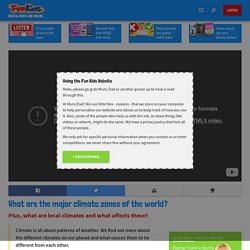
We find out more about the different climates on our planet and what causes them to be different from each other. When you hear the words “weather” and “climate” you might think they mean the same thing – but they’re quite different! It might be rainy today or it might be sunny – that’s the weather. But climate is the pattern of weather in a place over a much longer time.
Different parts of the world have very different patterns of weather. The other half is either absorbed by the atmosphere or reflected back into space. This video file cannot be played. When things aren’t in balance, nature likes to even things out. Accuweather. Bankstown Ap historical archives of daily temperature and rainfall. Bankstown Weather - Bureau of Meteorology. View the current warnings for New South Wales.
Will it rain today? How do you work it out? 00:00:03:23FLYNN:Surf's up.

Boy, oh, boy! Dodly, are you coming? 00:00:09:08DODLY:Coming, Flynn. Ooh, nice castle! How do you know when rain is coming? Seasons with Dirtgirl! Sydney Weather Report on Nine News Australia for 2.11.10. What's The Weather Like Today. Australia's official weather forecasts & weather radar - Bureau of Meteorology. Climate map shows which countries have the same weather as Australia. It's what draws millions of expats and holidaymakers year-on-year.
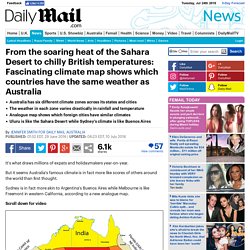
But it seems Australia's famous climate is in fact more like scores of others around the world than first thought. Sydney is in fact more akin to Argentina's Buenos Aires while Melbourne is like Freemont in western California, according to a new analogue map. Scroll down for video An analogue map shows how Australia's different climate zones compare to those of cities around the world It was created by comparing each of the city's average highest and lowest temperatures alongside its Koppen Classification which is the universal tool for categorising climates. According to the results, Uluru has the same climate as the Sahara Desert which can soar to more than 40C in summer. Brisbane, which has an average summer temperature of 26C, has a similar climate to Sao Paolo in Brazil while Cairns, a haven for beach bums and wildlife, is like Miami.
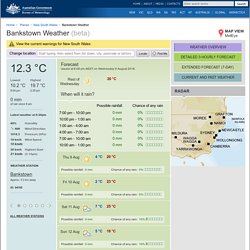
Tasmania, which is exposed to less sun and lower temperatures, is more like Britain. Explore the weather [includes spoken instructions] - (TLF L9 v11.0.0) Activities and weather. What is the weather at our place? Effects of dry weather. Sydney weather. Climate Data Online. Australia Weather - Bureau of Meteorology. Bankstown, NSW - Daily Weather Observations. IDCJDW2008.201807 Prepared at 05:36 UTC on Sunday 15 July 2018 Source of data Observations were drawn from Bankstown Airport AWS {station 066137}.
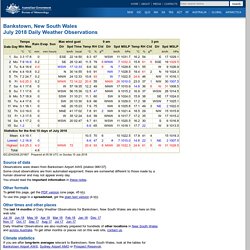
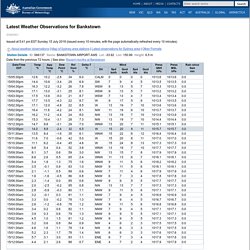
Some cloud observations are from automated equipment; these are somewhat different to those made by a human observer and may not appear every day. You should read the important information in these notes. Other formats To print this page, get the PDF version (one page, 45 kb). To use this page in a spreadsheet, get the plain text version (4 kb). Other times and other places The last 14 months of Daily Weather Observations for Bankstown, New South Wales are also here on this web site: Jul 18 Jun 18 May 18 Apr 18 Mar 18 Feb 18 Jan 18 Dec 17 Nov 17 Oct 17 Sep 17 Aug 17 Jul 17 Jun 17. Latest Capital City Observations Bankstown. Issued at 5:41 pm EST Sunday 15 July 2018 (issued every 10 minutes, with the page automatically refreshed every 10 minutes)
Climate statistics for Australian locations. Australian climate zones. Text description of Australian climate zones. The eight climate zones used in Your Home are defined by the Building Code of Australia (BCA). Each climate zone has distinctly different design and construction requirements. Within each main zone are many regional sub-zones determined by local geographic features including wind patterns and height above sea level. The Nationwide House Energy Rating Scheme (NatHERS) identifies 69 of these sub-zones, which the BCA addresses and which can be called up by postcode.