
Large Network Dataset Collection. Www.uvm.edu/~pdodds/files/papers/others/2006/kearns2006a.pdf. The Small-World Phenomenon: An Algorithmic Perspective 1. Jon Kleinberg 2 Abstract: Long a matter of folklore, the ``small-world phenomenon'' -- the principle that we are all linked by short chains of acquaintances -- was inaugurated as an area of experimental study in the social sciences through the pioneering work of Stanley Milgram in the 1960's.
This work was among the first to make the phenomenon quantitative, allowing people to speak of the ``six degrees of separation'' between any two people in the United States. Since then, a number of network models have been proposed as frameworks in which to study the problem analytically. One of the most refined of these models was formulated in recent work of Watts and Strogatz; their framework provided compelling evidence that the small-world phenomenon is pervasive in a range of networks arising in nature and technology, and a fundamental ingredient in the evolution of the World Wide Web. The Small-World Phenomenon. Modeling the Phenomenon. The Present Work. Let us return to Milgram's experiment. And. Cs.carleton.edu/faculty/dlibenno/papers/lj/lj.pdf. StatsModels: Statistics in Python — statsmodels documentation.
SNA tools. Network Graph of Programming Languages Influence. Data Visualization, Infographics, and Statistics. Data.csv - Google Fusion Tables. Network Graph - Google Fusion Tables Help. Current limitations include: The visualization will only show relationships from the first 100,000 rows in a table.
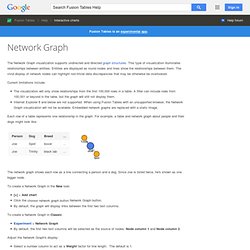
A filter can include rows from 100,001 or beyond in the table, but the graph will still not display them. Internet Explorer 8 and below are not supported. When using Fusion Tables with an unsupported browser, the Network Graph visualization will not be available. Embedded network graphs are replaced with a static image. Each row of a table represents one relationship in the graph. The network graph shows each row as a line connecting a person and a dog.
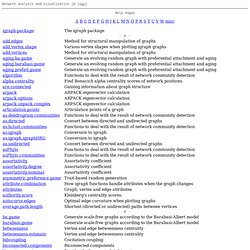
To create a Network Graph in the New look: [+] > Add chart Click the Network Graph button. To create a Network Graph in Classic: Experiment > Network Graph By default, the first two text columns will be selected as the source of nodes: Node column 1 and Node column 2. Adjust the Network Graph's display: Select a number column to act as a Weight factor for line length. Interact with the Network Graph: Good to know: Datavisualization.ch Selected Tools. [CFinder] Clusters and Communities: Overlapping dense groups in networks. R: Network analysis and visualization. Network analysis and visualization Help Pages ABCDEFGHIKLMNOPRSTUVWmisc -- misc --
The Social Organisation of Conspiracy - Illegal Networks... Baker, Faulkner. Network Structure and Information Advantage - Sinan Aral and Marshall Van Alstyne. Network data. This page contains links to some network data sets I've compiled over the years.
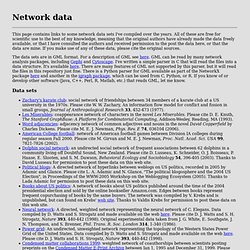
All of these are free for scientific use to the best of my knowledge, meaning that the original authors have already made the data freely available, or that I have consulted the authors and received permission to the post the data here, or that the data are mine. If you make use of any of these data, please cite the original sources. The data sets are in GML format. For a description of GML see here. GML can be read by many network analysis packages, including Gephi and Cytoscape. Data sets Zachary's karate club: social network of friendships between 34 members of a karate club at a US university in the 1970s. Other sources of network data There are a number of other pages on the web from which you can download network data. Review.pdf.