
Spojrzenia łapane infografiką. 5288 17840 1 PB. Wysyłanie wiadomości e mail dialogi 25. Posłuchaj podcastu: Jutronauci 2020: czy pandemia oswoi nas z wykresami? - TOK FM. SlideIdea Reviews. SlideIdea is a mobile app that redefines the presentation experience.
Slides are simple to use, fast to create, and highly interactive. Existing presentation tools, designed for laptops/desktops, make slides time consuming to create, difficult to share, and boring to observe. They fail to take advantage of the advances in cloud technology through mobile devices. Cut your design time in half by using SlideIdea’s smart widget & template technology. Templates are free to download, always-updating, and can help you spend less time designing and more time practicing your pitch. 10 free tools for creating infographics.
Done right, infographics can be a great way to make sense of complex data.
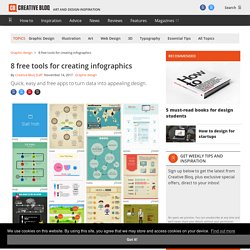
The best infographics transform complex information and data into graphics that are both easy to grasp and visually appealing. The only problem is, infographics that look like they were simple to make are often anything but. 46 Tools To Make Infographics In The Classroom. Infographics are interesting–a mash of (hopefully) easily-consumed visuals (so, symbols, shapes, and images) and added relevant character-based data (so, numbers, words, and brief sentences).
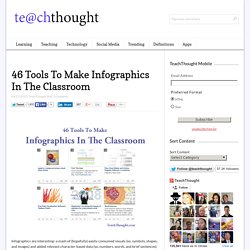
The learning application for them is clear, with many academic standards–including the Common Core standards–requiring teachers to use a variety of media forms, charts, and other data for both information reading as well as general fluency. It’s curious they haven’t really “caught on” in schools considering how well they bridge both the old-form textbook habit of cramming tons of information into a small space, while also neatly overlapping with the dynamic and digital world. So if you want to try to make infographics–or better yet have students make them–where do you start?
10 Fun Tools To Easily Make Your Own Infographics. People love to learn by examining visual representations of data. That’s been proven time and time again by the popularity of both infographics and Pinterest. So what if you could make your own infographics ? Create and design your own charts and diagrams online. Design flyers to spread the word online.
Create Interactive Online Presentations, infographics, animations & banners in HTML5 - Visme by Easy WebContent. New Library Infographics: 1930′s style. Library Infographics: 1930′s style Nowadays, the visualization of data is all the rage.
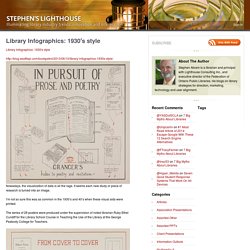
It seems each new study or piece of research is turned into an image. I’m not so sure this was as common in the 1930’s and 40’s when these visual aids were printed. The series of 28 posters were produced under the supervision of noted librarian Ruby Ethel Cundiff for the Library School Course in Teaching the Use of the Library at the George Peabody College for Teachers. Stephen. Datavisualization.ch Selected Tools. INFOGRAPHIC. Create infographics and online presentations. Mind Map and Concept Map Creating Tools & Tips. Infographic_CanIUseThatPicture4.jpg (JPEG Image, 2550 × 1650 pixels) - Scaled (40%) Course: Vizualizace informací se zaměřením na tvorbu infografiky, Topic: Co je to infografika a proč je vizualizace informací užitečná? 10 free tools for creating infographics. Wizualizacja danych - 5 darmowych narzędzi - Rynek Informacji.