
Introducing practical and robust anomaly detection in a time series. Both last year and this year, we saw a spike in the number of photos uploaded to Twitter on Christmas Eve, Christmas and New Year’s Eve (in other words, an anomaly occurred in the corresponding time series).

Anomaly Detection in R. Introduction Inspired by this Netflix post, I decided to write a post based on this topic using R.
There are several nice packages to achieve this goal, the one we´re going to review is AnomalyDetection. Download full -and tiny- R code of this post here. Normal Vs. Abnormal The definition for abnormal, or outlier, is an element which does not follow the behaviour of the majority. Data has noise, same example as a radio which doesn't have good signal, and you end up listening to some background noise. Anomaly Detection for Business Metrics with R - AnalyzeCore by Sergey Bryl' - data is beautiful, data is a story.
The larger and more complex the business the more metrics and dimensions.

One day you understand that it is impossible to track them with only your eyes. Reducing the number of metrics and/or dimensions can prevent us from tracking all aspects of the business or analyzing aggregated data (for example, without dimensions), which can substantially smooth out or hide the anomalies. In such a situation, the detection of any anomalies after the actual occurrence can either be missed or have a significant time gap. Therefore, we have to react immediately in order to learn about the event as soon as possible, identify its causes, and understand what to do about it. For this, we can use the Anomaly Detection system and identify abnormal values, collect the corresponding events centrally, and monitor a much larger number of metrics and dimensions than what human capabilities allow.
Feature Selection using Genetic Algorithms in R. This is a post about feature selection using genetic algorithms in R, in which we will do a quick review about: What are genetic algorithms?

GA in ML? What does a solution look like? GA process and its operatorsThe fitness functionGenetics Algorithms in R! Try it yourselfRelating concepts. Feature Selection : Select Important Variables with Boruta Package. This article explains how to select important variables using boruta package in R.

Variable Selection is an important step in a predictive modeling project. It is also called 'Feature Selection'. Every private and public agency has started tracking data and collecting information of various attributes. It results to access to too many predictors for a predictive model. Finding Variable Importance with Random Forest & Boruta. There are two problems in order to interpret the result of Random Forest’s ‘Variable Importance’.
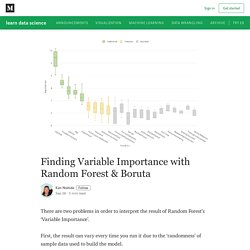
First, the result can vary every time you run it due to the ‘randomness’ of sample data used to build the model. Second, you don’t know which variables are actually meaningful and which are not for predicting the outcome. There is a method called Boruta, which helps to address these two problems. Implementation of 19 Regression algorithms in R using CPU performance data. - Data Science-Zing. Compare The Performance of Machine Learning Algorithms in R. How do you compare the estimated accuracy of different machine learning algorithms effectively?

In this post you will discover 8 techniques that you can use to compare machine learning algorithms in R. You can use these techniques to choose the most accurate model, and be able to comment on the statistical significance and the absolute amount it beat out other algorithms. Let’s get started. Practicing Machine Learning Techniques in R with MLR Package. A tutorial on tidy cross-validation with R - Econometrics and Free Software. Set up Let’s load the needed packages: library("tidyverse") library("tidymodels") library("parsnip") library("brotools") library("mlbench") Load the data, included in the {mlrbench} package: data("BostonHousing2") I will train a random forest to predict the housing price, which is the cmedv column: head(BostonHousing2) Only keep relevant columns: boston <- BostonHousing2 %>% select(-medv, -town, -lon, -lat) %>% rename(price = cmedv) I remove town, lat and lon because the information contained in the column tract is enough.
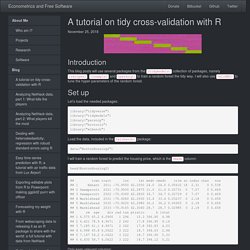
To train and evaluate the model’s performance, I split the data in two. ModelDown: a website generator for your predictive models – SmarterPoland.pl. I love the pkgdown package.

Random Forests in R. ModelDown: a website generator for your predictive models – SmarterPoland.pl. Visualize the Business Value of your Predictive Models with modelplotr. Why ROC curves are a bad idea to explain your model to business people Summary In this blog we explain four most valuable evaluation plots to assess the business value of a predictive model.

These plots are the cumulative gains, cumulative lift, response and cumulative response. A tutorial on tidy cross-validation with R - Econometrics and Free Software. Gradient Boosting and Parameter Tuning in R. Understanding Gradient Boosting Machines. Beginners Tutorial on XGBoost and Parameter Tuning in R Tutorials & Notes. Gradient boosting in R. XGBoostLSS – An extension of XGBoost to probabilistic forecasting – R-posts.com. Introduction To reason rigorously under uncertainty we need to invoke the language of probability (Zhang et al. 2020). Any model that falls short of providing quantification of the uncertainty attached to its outcome is likely to yield an incomplete and potentially misleading picture. While this is an irrevocable consensus in statistics, a common misconception, albeit a very persistent one, is that machine learning models usually lack proper ways of quantifying uncertainty.
Despite the fact that the two terms exist in parallel and are used interchangeably, the perception that machine learning and statistics imply a non-overlapping set of techniques remains lively, both among practitioners and academics. Vtreat Variable Importance. Vtreat‘s purpose is to produce pure numeric R data.frames that are ready for supervised predictive modeling (predicting a value from other values).
By ready we mean: a purely numeric data frame with no missing values and a reasonable number of columns (missing-values re-encoded with indicators, and high-degree categorical re-encode by effects codes or impact codes). In this note we will discuss a small aspect of the vtreat package: variable screening. Part of the vtreat philosophy is to assume after the vtreat variable processing the next step is a sophisticated supervised machine learning method. Under this assumption we assume the machine learning methodology (be it regression, tree methods, random forests, boosting, or neural nets) will handle issues of redundant variables, joint distributions of variables, overall regularization, and joint dimension reduction.
However, an important exception is: variable screening. Shapper is on CRAN, it’s an R wrapper over SHAP explainer for black-box models – SmarterPoland.pl. Written by: Alicja Gosiewska In applied machine learning, there are opinions that we need to choose between interpretability and accuracy. However in field of the Interpretable Machine Learning, there are more and more new ideas for explaining black-box models. One of the best known method for local explanations is SHapley Additive exPlanations (SHAP). The SHAP method is used to calculate influences of variables on the particular observation. This method is based on Shapley values, a technique borrowed from the game theory. The R package shapper is a port of the Python library shap. While shapper is a port for Python library shap, there are also pure R implementations of the SHAP method, e.g. iml or shapleyR.
Installation The shapper wraps up the Python library, therefore installation requires a bit more effort than installation of an ordinary R package. Install the R package shapper First of all we need to install shapper, this may be the stable release from CRAN install.packages("shapper") Patrick Schratz. The mlr-org team is very proud to present the initial release of the mlr3 machine-learning framework for R. mlr3 comes with a clean object-oriented-design using the R6 class system. With this, it overcomes the limitations of R’s S3 classes. Introducing mlrPlayground. DALEX for keras and parsnip – SmarterPoland.pl. iBreakDown plots for Sinking of the RMS Titanic.
A Gentle Introduction to tidymodels. By Edgar Ruiz Recently, I had the opportunity to showcase tidymodels in workshops and talks. Introducing mlrPlayground. TensorFlow for R: So, how come we can use TensorFlow from R? Which computer language is most closely associated with TensorFlow? While on the TensorFlow for R blog, we would of course like the answer to be R, chances are it is Python (though TensorFlow has official bindings for C++, Swift, Javascript, Java, and Go as well). Auditor: a guided tour through residuals. TensorFlow for R: So, how come we can use TensorFlow from R?