
How to Choose a JavaScript Charting Library. Developers face software evaluation and selection tasks on a regular basis.

But one such task that may have significant ramifications on timeline, budget, and success is the selection of a JavaScript library. And choosing a JavaScript charting library can be particularly arduous. Devs are often quick to say one library or another is “the best.” But in reality, no single library can: Fulfill the requirements of every project Accommodate the skills of every team Be the lowest priced option Seeking one library to rule them all is like committing to eating with a spork at every meal. A fork makes eating liquids impossible. A spoon does not allow you to pierce bite sized pieces. You might consider a spork to get the best of both worlds. And the same goes for libraries (charting or otherwise): there is no single best. Spork image via Flickr ZingChart is not a spork. In the “real world,” we pick our tools after we find out which home repair we need to perform, not before. Comparison of JavaScript charting frameworks. Taucharts flexible javascript charting library for data exploration.
Datavisualization.ch Selected Tools. Example of using events in Telerik ASP.NET MVC Grid control. Library - Home - Recline Data Explorer and Library. Data visualization. Ember Charts. 開發者必了解的35個JavaScript圖表和圖形庫 - 每日頭條. 開發者必了解的35個JavaScript圖表和圖形庫 - 每日頭條.
JavaScript Charts in one powerful declarative library. GitHub - juliusknth/high-on-backend: awesome backend design with bootstrap, highcharts, datatables, select2 etc. GitHub - fairmat/DotNet.Highcharts: Highcharts integration with ASP.NET/.NET applications. 子圖d3測試. Show data labels for specific data points - amCharts. JavaScript Charts. Features Powerful data-viz Advanced serial charts We made it easy to display complex data visualizations. Combine various graph types on a single chart. Create clusters, or stacks, or clusters of stacks. Superior time-based scales When displaying flat series just doesn’t cut it, amCharts comes in with true date/time scale support.
Micro-charts and sparklines Reduce the charts to complete minimal configuration to produce tiny but usable micro charts by disabling a few components like axes, legends and margins. Functional Interactive Zoom or pan serial charts, drill-down to other data levels, select slices, toggle graphs using legend, display HTML-rich contextual info, or draw trend lines directly on chart. Export options Annotate and export charts dynamically to various formats including static images, SVG, PDF, Excel, and CSV. AnyChart 7 HTML5 charts Features. Cloudformatter. Who are we?
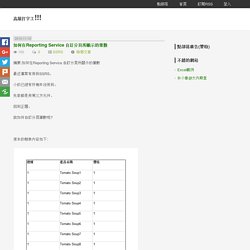
Xportability is small group of industry experts who develop software applications and provide targeted information technology solutions as well as document production services. We specialize in the these application areas: cloudformatter This site is all about one of the technologies we have developed and implemented for many people. 如何在Reporting Service 自訂分頁所顯示的筆數. 摘要:如何在Reporting Service 自訂分頁所顯示的筆數.
50+ Free Resources for Charts and Graphs Solution. A chart or a graph is a visual representation of data, in which “the data are represented by symbols, such as bars, lines, or slices”.
These symbols can represent tabular numeric data, functions or some kinds of qualitative structures. For one reason or another, a lot of freelancers use Charts and Graphs to display the meaningful data visualizations. As a full-time freelancer and part-time geek, I really like to display my data analytics on pie charts and graphs too. Nowadays, there are over hundred thousands of resources available on the web. Instead of spending time on researching for the ones you needed, we pick the top and intelligent ones for you. A chart can take a large variety of forms, however there are common features that provide the chart with its ability to extract meaning from data.
Typically a chart is graphical, containing very little text, since humans are generally able to infer meaning from pictures quicker than from text. d3 - cdnjs.com - The free and open source CDN for web related libraries to speed up your website! Part 1: The essential collection of visualisation resources. Data Visualization Network of Resources. Datavisualization.ch Selected Tools. Flot Examples.
D3.js. NVD3JS. Geo Data Visualization. DC.js. c3.js. Google Charts. jQuery HighchartTable plugin. The HighchartTable plugin takes data and attributes from a table and parses them to simply create an Hightcharts chart.
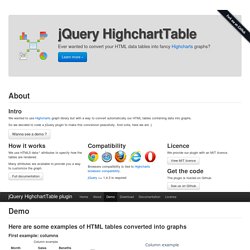
The plugin does not contains Highcharts or jQuery, so first of all, you must include them your page. Then you have to set some attributes to the table, like the graph type or where to render the graph. The series names are defined in the <thead>, their values are defined in the <tbody>. The first <td> of a <tr> contains the Xaxis value. The other ones contain the values for each series in that x value. JavaScript Graphing Library Comparison. A Visual Backchannel for #parkingday. SVG 研究之路 (24) - 寫 jquery 產生圓餅圖 - OXXO.STUDIO. Benfred/venn.js. Circos Table Viewer - Circular Visualization of Tabular Data // with Circos - Circular Genome Data Visualization. Before uploading a data file, check the samples gallery to make sure that your data format is compatible. Your file must be plain text. Your data values must be non-negative integers. Data must be space-separated (one or more tab or space, which will be collapsed). No two rows or columns may have the same name.
Column and row names must begin with a letter (e.g. Need help? If you are using the size, order or color options below, make sure your input file has the appropriate content (see samples 5-9). Don't have a data file? Current load is 0/5. Do not use this tool on confidential, sensitive or otherwise expensive, inflammatory or incriminating information (use the offline tableviewer which has a tutorial).
[SVG]SVG 基本圖形 - 路徑 path. [SVG]SVG 基本圖形 - 路徑 path. 39 Data Visualization Tools for Big Data. Big Data is more valuable when visualized and analyzed Data visualizations are everywhere and are more important than ever.
From creating a visual representation of data points as part of an executive presentation, to showcasing progress, or even visualizing concepts for customer segments, data visualizations are a critical and valuable tool in many different situations. When it comes to big data, weak tools with basic features don’t cut it. The following 39 data visualization tools for big data (listed in no particular order) are some of the best, most comprehensive, sophisticated-yet-flexible visualization tools available. Many of these tools are Open-Source, free applications that can be used in conjunction with one another or with your existing design applications, using JavaScript, JSON, SVG, Python, HTML5 or drag-and-drop functionality that requires no programming at all.