
Data Visualization. Ideas, issues, knowledge, data - visualized! Except: Integrated Sustainability Consult, Research & Design.
Open Source Charting & Reporting Tools in Java. Paraview. CTC Virtual Workshop. Important to note is the ability of a package to transform data from your program.
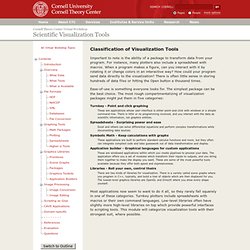
For instance, many plotters also include a spreadsheet with macros. When a program makes a figure, can you interact with it by rotating it or change colors in an interactive way? How could your program send data directly to the visualization? There is often little sense in storing hundreds of data files or hitting the Open button a thousand times. Ease-of-use is something everyone looks for. Turnkey - Point and click graphing These are applications whose user-interface is either point-and-click with windows or a simple command-line.
Data compilator. Data Visualization. Data and Graphs with JavaScript. Data Visualization Authors and Blogs. Heatmap. University of Maryland, Human-Computer Interaction Lab. Data exploration. Zoomable interface. Inkscape svg. LaTex graphs. Dendogram. Processing. Faz Caber. Qual é a importância da edição visual em uma revista?
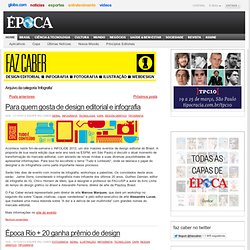
Até que ponto vale investir tempo nisso, ainda mais quando ele é escasso? Nós, do design, fotografia e infografia da Época, acreditamos que esse é um aspecto importantíssimo mesmo que custe um esforço maior de todos. Por isso sempre peitamos esse desafio. A edição desta semana é prova disso. Como montar o seu prato A matéria de capa foi um daqueles trabalhos que envolvem muita gente e vêm carregado de muita expectativa e ansiedade. Mas mesmo assim poderíamos ir além. Mão na massa. Diagrama A seção que já é velha conhecida de quem acompanha o Faz Caber.
O Diagrama desta semana fala sobre o derretimento das camadas de gelo do Ártico. Esse gráfico foi feito com base em um estudo do site The Cryosphere Today, que faz a medição dia a dia. É isso que mostra esse gráficão de linhas. O governo comemorou semana passada a melhora dos números do Ideb. Como se tornar uma potência olímpica Vida Útil.
40 Ways of Visualizing Brazil’s Historical Election. This is a special guest post by Tiago Veloso from Visual Loop – a non-stop stream of Infographics, Maps, Charts and many other Visualization Goodies, with lots of new posts everyday.
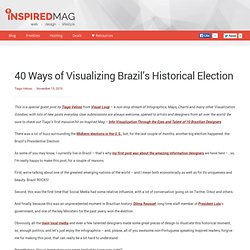
User submissions are always welcome, opened to artists and designers from all over the world. Be sure to check out Tiago’s first massive hit on Inspired Mag – Info-Visualization Through the Eyes and Talent of 10 Brazilian Designers There was a lot of buzz surrounding the Midterm elections in the U.S., but, for the last couple of months, another big election happened: the Brazil’s Presidential Election. As some of you may know, I currently live in Brazil – that’s why my first post was about the amazing information designers we have here – , so, I’m really happy to make this post, for a couple of reasons.
First, we’re talking about one of the greatest emerging nations of the world – and I mean both economically as well as for its uniqueness and beauty. Época Magazine The Vote’s Geography Political Alliances. The igraph library for complex network research. Graph Visualization Software. Rgraphics. R Graphicsby Paul Murrell The SECOND EDITION of this book is now available, with its own web page.
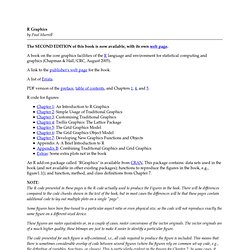
A book on the core graphics facilities of the R language and environment for statistical computing and graphics (Chapman & Hall/CRC, August 2005). A link to the publisher's web page for the book. KML Interactive Sampler. Which school districts have high rates of poverty in Washington State? - Wiki Ed Data. Data visualization - Open Source DrasticTools. Data compilator. Gephi, an open source graph visualization and manipulation software. Zero Intelligence Agents. This happens to be one of those rare instances where the benefit of hindsight does not make me regret something said flippantly on a panel.
I deeply believe that in order to truly change the world we cannot simply "throw analytics at the problem. " To that end, the medical and health industries are perhaps the most primed to be disrupted by data and analytics. To be successful, however, a deep respect for both the methodological and clinical contexts of the data are required. It is incredibly exciting to be at an organization that is both working within the current framework of health care and data to create new insight for people, but also pushing the envelope with respect to individuals' relationships with their own health.
The challenges are technical, sociological, and political; but the potential for innovation that exists in this space comes along very rarely. I feel lucky to have an opportunity to move into the health data space now. StatPlanet Map Maker – Interactive Mapping & Visualization Software. Visualization Toolkit. The Visualization Toolkit (VTK) is an open-source, freely available software system for 3D computer graphics, image processing and visualization.
VTK supports a wide variety of visualization algorithms including: scalar, vector, tensor, texture, and volumetric methods; and advanced modeling techniques such as: implicit modeling, polygon reduction, mesh smoothing, cutting, contouring, and Delaunay triangulation. VTK has an extensive information visualization framework, has a suite of 3D interaction widgets, supports parallel processing, and integrates with various databases on GUI toolkits such as Qt and Tk. Please enable JavaScript to view the <a href=" powered by Disqus. How to be a data journalist. Data journalism is huge.
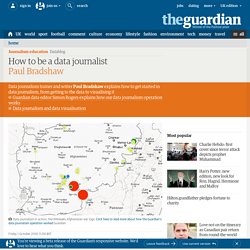
I don't mean 'huge' as in fashionable - although it has become that in recent months - but 'huge' as in 'incomprehensibly enormous'. It represents the convergence of a number of fields which are significant in their own right - from investigative research and statistics to design and programming. The idea of combining those skills to tell important stories is powerful - but also intimidating. Visual Thinking. InfoGraphics (Visual Maps)