
Avec les nouveaux iPhone, la réalité augmentée enfin prête à décoller ? Des plats qui s’affichent dans l’assiette d’un restaurant avant de passer commande, des meubles virtuels à placer dans son salon ou encore une attaque de morts-vivants.
Ces dernières semaines, les démonstrations de prochains jeux et applications mobiles en réalité augmentée se sont multipliées sur YouTube ou Twitter. Ce n’est qu’un début: sous l’impulsion d’Apple, qui dévoile mardi 12 septembre ces nouveaux iPhone, et de Google, cette technologie va bientôt envahir les smartphones et tablettes. La réalité augmentée, qui permet de superposer des éléments virtuels dans le monde réel, a déjà connu un premier succès d’envergure il y a un an, avec le jeu phénomène Pokémon Go. Manaberry _ 4Dviews - 360° VFX. Portfolio de Louis Eveillard. Ferdinand Dervieux. Critical Atlas of Internet. Spatial analysis as a tool for socio-political purposes Travail de recherche théorique et graphique mené par Louise Drulhe.
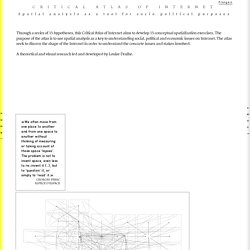
Juin 2015. Internet is a Point Online, Distance is Not Relevant A Global Object Projected at the Local Level. Human-based computation game - Wikipedia. A human-based computation game or game with a purpose (GWAP[1]) is a human-based computation technique of outsourcing steps within a computational process to humans in an entertaining way (gamification).[2][3] Luis von Ahn first proposed the idea of "human algorithm games", or games with a purpose (GWAPs), in order to harness human time and energy for addressing problems that computers cannot yet tackle on their own.
He believes that human intellect is an important resource and contribution to the enhancement of computer processing and human computer interaction. He argues that games constitute a general mechanism for using brainpower to solve open computational problems. In this technique, human brains are compared to processors in a distributed system, each performing a small task of a massive computation. However, humans require an incentive to become part of a collective computation. The tasks presented in these games are usually trivial for humans, but difficult for computers. Unity datamoshing.
Un grand entretien avec Bernard Stiegler : « Le rôle de l’art ? Produire du discernement ! » - L'Oeil - n° 633 - Mars 2011. Le consumérisme culturel et les nouvelles technologies sont les chevaux de bataille de ce philosophe atypique pour qui il faut défendre l’art et la culture.
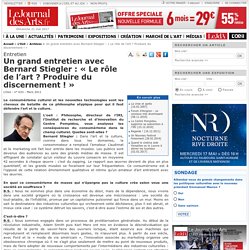
L'oeil : Philosophe, directeur de l’IRI, l’Institut de recherche et d’innovation du Centre Pompidou, vous analysez les conséquences du consumérisme dans le champ culturel.
Le musée virtuel - Bernard Deloche - Questions - Format Physique et Numérique. Nouvelle revue d'esthétique 2013, n° 11 - - Nouvelle revue d'esthétique - Format Physique et Numérique. Dominique Peysson : L’image-matière. Paru en avril 2016 édition française 16,5 x 21,5 cm (broché) 128 pages (20 ill. coul. et 20 ill. n&b) en stock.
Smoothie-3D. Convert your image into 3d automatically. Generating fantasy maps. These are some notes on how I generate the maps for my Twitter bot @unchartedatlas, which is based on a generator I originally produced during NaNoGenMo 2015.
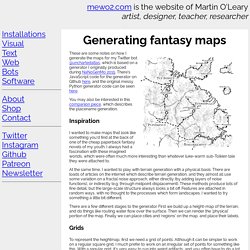
There's JavaScript code for the generator on Github here, and the original messy Python generator code can be seen here. You may also be interested in this companion piece, which describes the placename generation. Inspiration I wanted to make maps that look like something you'd find at the back of one of the cheap paperback fantasy novels of my youth. Creative Applications of Deep Learning with TensorFlow. Turn 2D into 3D with 3Defy! Just because you don’t have a 3D camera does not have to mean you can’t participate in 3D photography—thanks to companies such as 3Defy, which make software that you can use to transform your 2D images into stereoscopic 3D shots you can view with your 3D Vision™ hardware.
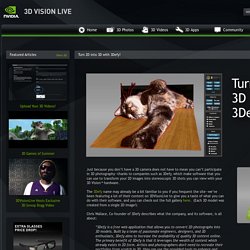
The 3Defy name may already be a bit familiar to you if you frequent the site—we’ve been featuring a lot of their content on 3DVisonLive to give you a taste of what you can do with their software, and you can check out the full gallery here. (Each 3D model was created from a single 2D image!) Chris Wallace, Co-founder of 3Defy describes what the company, and its software, is all about: A city built from memory. Cultural Data Sculpting: Omni-spatial Visualization for Large Scale Heterogeneous Datasets. 1.
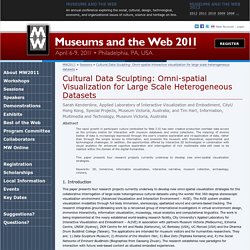
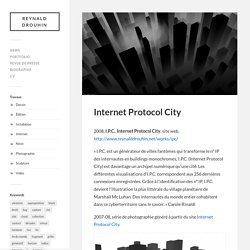
Introduction. Recreate the Cinema Redux effect. Internet Protocol City – Reynald Drouhin. 2008, I.P.C., Internet Protocol City, site web. « I.P.C. est un générateur de villes fantômes qui transforme le n° IP des internautes en buildings monochromes, I.P.C.
Lev Manovich - Selected Projects & Exhibitions. Inequaligram View Project Website 2016 Inequaligram measures social media inequality in NYC using 7.5M Instagram images.
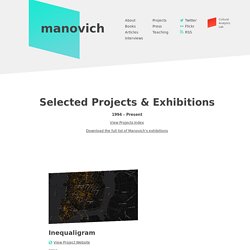
Read more → On Broadway View Project Website 2015 The interactive installation and web application "On Broadway" represents life in the 21st-century city through a compilation of images and data collected along the 13 miles of Broadway that span Manhattan. Read more → Selfiecity View Project Website 2014 Interactive web app for exploring a dataset of 3200 Instagram selfie photos, and separate visualizations of these photos created with custom software. Together with Dominikus Baur, Jay Chow, Daniel Goddemeyer, Nadav Hochman, Moritz Stefaner, Alise Tifentale, and Mehrdad Yazdani. Literary Constellations - C82: Works of Nicholas Rougeux. When a story is well-written, you can become so immersed while reading that it becomes your world.
All your surroundings disappear and all that remains are the words on the page guiding you through the story. These words can be transformed into constellation-like diagrams. The first words of a story—and even every chapter—are unique in that they set the stage for what's to come. Constellations were created from words of first sentences of each chapter in classic short stories to draw a paths based on word length and part of speech. The directions of lines were based on part of speech (noun, verb, adjective, etc.) and length is based on the length of the word.
Information aesthetics - Data Visualization & Information Design. A visual exploration on mapping complex networks. DataArt - Visualisations. FlowingData. Data Art : la donnée comme matériau d’origine. Algorithmic Art : L’ère de l’automatisation de l’art.
Data Art, l'art d'un monde d'informations. The Ekmans' Atlas of Emotions. Data Visualization and Feelings - Scientific American Blog Network. In a memorable talk at OpenVisConf earlier this year, data journalist Mona Chalabi posited that there is no such thing as an emotionless data visualization. There is a person behind each visualization, she reasoned, and that person has feelings about the information she is representing. Whether consciously or not, those feelings are often revealed in the visual design decisions that characterize the resulting image. In science visualization, however, the goal is often to be as detached as possible. When representing scientific data, we are generally not trying to evoke an emotional response from our readers, but rather to allow them to explore the data and draw empirical conclusions themselves.
While those conclusions may carry emotional weight, it is not the job of the visualization to arouse those feelings directly. A recent project called Atlas of Emotions takes the idea of detachment in data visualization and turns it on its head. Data Games. Data games are games that use real-world information for creating their content. Data is incorporated into game content under the assumption that players should view, learn and interact with such data during gameplay. CEA LIST - Vision and Content Engineering Lab- Vision and Content Engineering Lab. Wang Group: Modeling Objects, Concepts, Aesthetics, and Emotions in Big Visual Data.
About Prof. James Z. Wang Dr. Wang has been on Penn State faculty since 2000, where he is Professor of the College of Information Sciences and Technology. He is also Affiliated Professor of the Molecular, Cellular, and Integrative Biosciences (MCIBS) Program (Option on Bioinformatics and Genomics, the Huck Institutes of the Life Sciences). Other pictures: 4/2000 Stanford, 9/2007 Beijing, 4/2010 State College, 4/2010, 8/2010, 9/2010, 12/2013, 12/2014, 12/2015, 12/2016. Moebio Labs website. Software Studies Initiative. Cultural Analytics Lab. Imagga - powerful image recognition APIs for automated categorization & tagging. Where Seeing is Tagging - Autotagging with PicScout. Where Seeing is Believing Tagging. Intelligent photo keywording tool for photographers. CJC - FAQ : À propos du doctorat. The Lab at the Cultural Institute, a crossroads of ideas, art and technology. Play now The Google Cultural Institute creates new technology to help partners publish their collections online and reach new audiences, as seen in the Google Art Project, Historic Moments and World Wonders initiatives.
We created The Lab in Paris as a place where tech and creative communities come together to share ideas and discover new ways to experience art and culture. We welcome experts, creatives, curators, artists, designers and educators to help us craft new bridges between tech and culture. Contact us to make more amazing things happen. Site presse - Institut Culturel de Google. About – 89plus. 89plus is a long-term, international, multi-platform research project co-founded by Simon Castets and Hans Ulrich Obrist, investigating the generation of innovators born in or after 1989. Without forecasting artistic trends or predicting future creation, 89plus manifests itself through panels, books, periodicals, exhibitions and residencies, bringing together individuals from a generation whose voices are only starting to be heard, yet which accounts for almost half of the world’s population.
Marked by several paradigm-shifting events, the year 1989 saw the collapse of the Berlin Wall and the start of the post- Cold War period, and the introduction of the World Wide Web and the beginning of the universal availability of the Internet. Positing a relationship between these world-changing events and creative production at large, 89plus introduces the work of some of this generation’s most inspiring protagonists. Experiments. What are Google Arts & Culture Experiments? At the Google Cultural Institute’s Lab, a team of Google software engineers, artists and creative coders come together to experiment at the crossroads of art and technology. We believe that through the collaboration with the cultural sector, curators and artists we can develop the best tools and technology for cultural institutions around the world.
We created this space for you to explore the Google Arts & Culture Experiments. The Experiments are aimed at discovering new ways people can explore art and browse the collections of our partner museums from around the world. Project Alexandria - Helping you find your next favorite book. ImagePlot visualization software: explore patterns in large image collections. What is ImagePlot? ImagePlot is a free software tool that visualizes collections of images and video of any size. It is implemented as a macro which works with the open source image processing program ImageJ. ImagePlot was developed by the Software Studies Initiative with support from the National Endowment for Humanities (NEH), the California Institute for Telecommunications and Information Technology (Calit2), and the Center for Research in Computing and the Arts (CRCA). See your whole image collection in a single visualization. Existing visualization tools show data as points, lines, and bars. Better understand media collections and make new discoveries.
Exploring Time in Structured Video. UberNet demo. Towards Organogenesis: For an Instrumental Approach in Research in Art. Entretien avec David McCandless : l'information par la visualisation. « La nouvelle économie mondialisée entre les mains d’un petit nombre d’entreprises » Tous les gifs vintage de vos rêves sont sur GifCities. Les genres d'émotions. De la pathétique artistique à l’émotion esthétique. Muséologie, archéologie et impression 3D - Aniwaa. Commons. Art contemporain: la peau de l'ours. Les innovations numériques de la muséologie — Enseigner avec le numérique.
Museo 30 05 07 GaleriesVirtuelles. Ilovepdf.com split 13. Christian Fauré - L’art de la mémoire. Christian Fauré - Cultural Analytics. Introduction à "Matière numérique : la production et l'invention de formes, Vers une esthétique nouvelle". Odile Blin. Visualizing Emotions: Turning ‘Dry’ Data Into Stories. Four perspectives on personal games. Research: Lev Manovich Coins the Term 'Media Visualization'