
Small Design Firm NRC: Naturalist Tables, Raleigh, North Carolina, 2012 Small Design Firm developed two completely custom interactive tables for the Nature Research Center at the North Carolina Museum of Natural Sciences. Visitors to the museum are invited to pick up actual specimens from the museum collection and place them on to the table surface. When the table reads the tagged specimen, video projection from above reveals activities and field guide information pertaining to the specimen.
“Drug Deal” Network Analysis with Gephi (Tutorial) Via a trackback from Check Yo Self: 5 Things You Should Know About Data Science (Author Note) criticising tweet-mapping without further analysis (“If you’re making Gephi graphs out of tweets, you’re probably doing more data science marketing than data science analytics. And stop it. Please. I can’t take any more. … what does it gain a man to have graphs of tweets and do jack for analysis with them?”), I came across John Foreman’s Analytics Made Skeezy [uncourse] blog:
Bio – Marius Watz Marius Watz (NO) is an artist working with visual abstraction through generative software processes. His work focuses on the synthesis of form as the product of parametric behaviors. He is known for hard-edged geometrical forms and vivid colors, with outputs ranging from pure software works to public projections and physical objects produced with digital fabrication technology. Making Data Work GE Works. Building, Moving, Powering and Curing the world. In the process, our technologies are generating data on a petabyte scale. This data contains valuable information that will drive insights, innovations, and discoveries, but it can be difficult to access and digest. Using data visualization, we’re pairing science and design to simplify the complexity and drive a deeper understanding of the context in which we operate.
Voyagers and Voyeurs: Supporting Asynchronous Collaborative Information Visualization The sense.us collaborative visualization system. (a) An interactive visualization applet, with a graphical annotation for the currently selected comment. The visualization is a stacked time-series visualization of the U.S. labor force, broken down by gender. Here the percentage of the work force in military jobs is shown. (b) A set of graphical annotation tools. (c) A bookmark trail of saved views.
2012 Perceptual Edge Dashboard Design Competition: We Have a Winner! I was pleased and frankly surprised to receive 91 submissions to my dashboard design competition. Surprised because designing a student performance dashboard from scratch based on the data that I provided was not a trivial task. I was especially pleased to find a dramatic improvement over the general quality of entries since the last competition that I judged back in 2006. 10 significant visualisation developments: July to December 2012 To mark the milestone of each mid-year and end of year I try to take a reflective glance over the previous 6 months period in the data visualisation field and compile some of the most significant developments. These are the main projects, events, new sites, trends, personalities and general observations that have struck me as being important to help further the development of this field. Earlier this year I published this collection for the first 6 months of 2012 and now I’d like to mark the end of 2012 with my latest perspective. I look forward to hearing from you with suggestions for the developments you believe have been most significant.
40 Essential Tools and Resources to Visualize Data One of the most frequent questions I get is, "What software do you use to visualize data?" A lot of people are excited to play with their data, but don't know how to go about doing it or even start. Here are the tools I use or have used and resources that I own or found helpful for data visualization – starting with organizing the data, to graphs and charts, and lastly, animation and interaction. Organizing the Data by sleepy sparrow Data are hardly ever in the format that you need them to be in. Graphic Sociology » Seeing Social Data Cairo, Alberto. (2013) The Functional Art: An introduction to information graphics and visualization. Berkeley: New Riders, a division of Pearson. Overview A functional art is a book in divided into four parts, but really it is easier to understand as only two parts. The first part is a sustained and convincingly argument that information graphics and data visualizations are technologies, not art, and that there are good reasons to follow certain guiding principles when reading and designing them.
featured projects Quantified Other Five weeks of my father's Nike Fuel data Tatelets Generative bracelet based on artworks from Tate Modern Threads revisit revisit is a real–time visualization of twitter messages (tweets) around a specific topic. You can create your own twitter wall at a conference or an ambient display at your company or whatever use you come up with. In contrast to other twitter stream tools, it provides a sense of the temporal dynamics in the twitter stream, and emphasizes the conversational threads established by retweets and @replies. chartsnthings 19 Sketches of Quarterback Timelines On Sunday Eli Manning started his 150th consecutive game for the Giants, the highest active streak in the NFL and the third-longest streak in NFL history. (One of the other two people above him is his brother, Peyton.) The graphics department published an interactive graphic that put Eli’s streak in the context of about 2,000 streaks from about 500 pro quarterbacks. The graphic lets you explore the qbs and search for any quarterback or explore a team to go down memory lane for your team. It’s not particularly important news, but the data provided by pro-football-reference is incredibly detailed and the concept lended itself to a variety of sketches.
That’s green, well maybe more blueish. You mean Grue? During my senior year at Savannah College of Art and Design, I took Language, Culture and Society with Désiré Houngues. Two cultural insights about language stuck with me. In some societies men and women speak with entirely different vocabularies but still communicate verbally with one another.
Showcases on Datavisualization Interactively Explore the YOLO Flip 12 Feb 2014 Showcases Animation, Interactive, Process, Sports In preparation of the Winter Olympic Games 2014 in Sochi, we helped the Swiss newspaper Neue Zürcher Zeitung publish a long-form article about Iouri Podladtchikov, a professional snowboarder and – since yesterday – freshly baked Olympic gold medalist. To help readers better understand the sport, we created a series of illustrations and an interactive animation. Read more
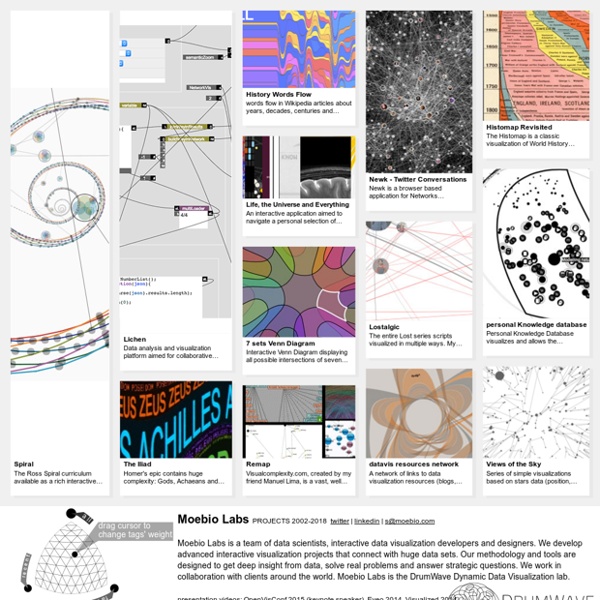
Site que apresenta a biografia do Matemático e designer Santiago Ortiz e seu portifóflio by izabelgoudart Aug 25