
Intellectual Property Solutions. Add power to your data analysis by quickly uncovering strategic insights you might otherwise miss from large amounts of patent and non-patent data.
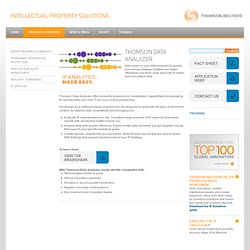
Thomson Data Analyzer offers powerful analysis and visualization capabilities for evaluating IP opportunities and risks. From your unique perspective. Developed as a software-based analysis tool, it's designed to work with all types of structured content, for optimal data compatibility and throughput to: Evaluate IP opportunities and risk. Transform large amounts of IP data into actionable reports with results that matter most to you. To learn more: With Thomson Data Analyzer, easily identify companies with: Technologies similar to yours Strong innovation pipelinesSuccess in securing patent protectionNotable university collaborationsKey inventors and innovation teams.
Store.inspiration.com/default.asp. Business Intelligence Software and Rich Information Applications from Actuate. Windows 8 Diagramming, Floor Planning and Flowcharting Tool. Mind Maps for Education. XMind: Professional & Powerful Mind Mapping Software.
BI Visualization Gallery. Grapheur: Business Intelligence and Interactive Visualization tool. Omniscope. Integrates two distinct workspaces in a single, in-memory, file-based application that enables agile, 'best practise' data sharing solutions with end user self-sufficiency spanning the entire workflow; data import, integration, transformation, analysis and presentation/publication:DataManager: data extraction from most sources, transformation, integration and delivery of processed data sets in a wide variety of formatsDataExplorer: interactive visual data discovery & analysis, multi-tan, multi-view reporting/'dashboarding'/publication in a wide variety of formats Users can quickly connect to local, network or online data sources, transform/scrub and integrate the data, then seamlessly create a refreshable, interactive multi-view report, deliverable to recipients in a wide variety of static and interactive formats, most powerful being the via Omniscope free Viewer.
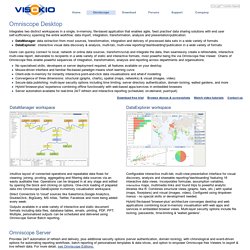
New in Omniscope version 2.8 Download free trial Browse demos & screenshots Watch video tutorials Contact us. Quadrigram. SPSS Visualization Designer. Create compelling visualizations to communicate analytic results IBM® SPSS® Visualization Designer enables you to develop and share customized data visualizations, from simple charts to advanced graphics.
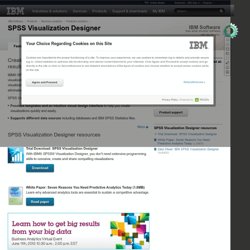
The solution makes the creation of data visualizations accessible to non-technical users. With a drag-and-drop design interface, it eliminates the need for advanced programming skills. SPSS Visualization Designer allows you to visually portray and communicate analytics to others. Provides templates and an intuitive visual design interface to help you create visualizations quickly and easily. More Less Provides templates and an intuitive visual design interface Get started quickly with dozens of built-in visualization templates.
Supports different data sources Provides support for delimiter-separated SPSS Statistics data files. SPSS Visualization Designer resources Download Read paper. Sample Dashboards. Cogito Intelligence API. Overview - Business Discovery, Data Visualization, Dashboards, Analytics. No-one makes decisions based just on hard numbers, but on inputs from the world around them, including conversations with others.
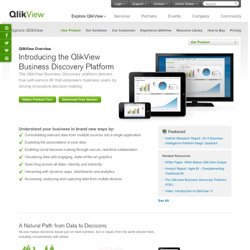
Close People With Social Business Discovery, you can collaboratively generate shared insight in real-time to more rapidly create innovative decisions. People Collaborative decision-making with colleagues via Social Business Discovery Data QlikView delivers answers as fast as you can think up questions. STN Anavist. Omniviz. Instem’s OmniViz is a powerful commercial off-the-shelf data mining and visual analytics tool that allows users to analyse and explore data sets through interactive visualizations.
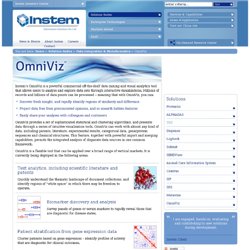
Millions of records and billions of data points can be processed – meaning that with OmniViz, you can: Discover fresh insight, and rapidly identify regions of similarity and difference Project data free from preconceived opinions, and so unearth hidden features Easily share your analyses with colleagues and customers OmniViz provides a set of sophisticated statistical and clustering algorithms, and presents data through a series of intuitive visualization tools. OmniViz can work with almost any kind of data, including patents, literature, experimental results, categorical data, gene/protein sequences and chemical structures. This feature, together with powerful import and merging capabilities, permits the integrated analysis of disparate data sources in one common framework.
Visit our new Blog! Visual, Engaging Storytelling. Many Eyes. Link Analysis, Data Visualization, Social Network Analysis (SNA) and Geospatial Software for Big Data.