
Time Spent In Apps Up 21% Over Last Year. While there may be an upper limit as to how many apps people interact with over the course of a month, new data from mobile marketing platform Localytics out this morning shows that the time spent actually using apps is increasing.

In fact, the average time people spend in their apps is up by 21% year-over-year, with music, health and fitness, and social apps showing the largest increases. The new study was based on data from Localytics’ customer base, which includes 28,000 applications installed across 1.5 billion devices. For these findings, which cover August 2013 to August 2014, the company says it multiplied the average sessions per user in app by the average session length across all apps, and then broke it down by category.
The data also backs up what we’ve already heard from other sources. For instance, Nielsen recently said consumers were now spending an average of 30+ hours per month, and had an average of 26.8 apps installed on their mobile devices, as of Q4 2013. Most smartphone users download zero apps per month - Quartz. Mobile apps have skyrocketed in popularity and utility since Apple introduced the iPhone App Store in the summer of 2008.
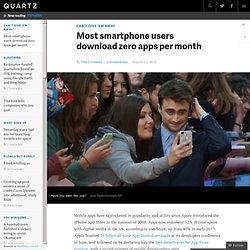
Apps now represent 52% of time spent with digital media in the US, according to comScore, up from 40% in early 2013. Apple boasted 75 billion all-time App Store downloads at its developers conference in June, and followed up by declaring July the best month ever for App Store revenue, with a record number of people downloading apps. Yet most US smartphone owners download zero apps in a typical month, according to comScore’s new mobile app report.
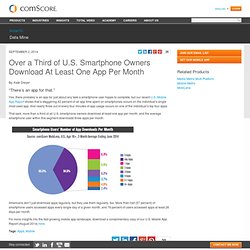
Only about one-third of smartphone owners download any apps in an average month, with the bulk of those downloading one to three apps. The top 7% of smartphone owners account for “nearly half of all download activity in a given month,” comScore reports. Why is this? Over a Third of U.S. Smartphone Owners Download At Least One App Per Month. September 2, 2014 By: Kate Dreyer “There’s an app for that.”
Yes, there probably is an app for just about any task a smartphone user hopes to complete, but our recent U.S. Benchmarking the Half-Life and Decay of Mobile Apps. Developers devote a lot of attention to the time immediately after an app is launched.

How quickly is it growing? Will it go viral? How is it ranking in app stores? While that launch period is critical, managing apps well throughout their entire lifecycle means also paying special attention to what happens after an app peaks. Does it decline precipitously or manage to hold much of its audience for a long time? We explore the post peak phase of the lifecycle of mobile apps using the concept of a half-life, which for purposes of this analysis we define as the point at which an app’s monthly users (MAU) have declined to 50% of their lifetime peak. We start by looking at the overall rate of decay for 26,176 apps that peaked in the first half of 2011, 2012, and 2013.
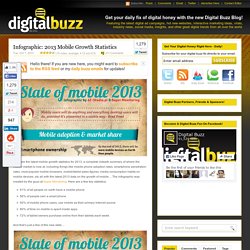
Mobile App Statistics. 2013 Mobile Growth Statistics Here are the latest mobile growth statistics for 2013, a complete indepth summary of where the mobile market is now at, including things like mobile phone adoption rates, smartphone penetration rates, most popular mobile browsers, mobile/tablet sales figures, media consumption habits on mobile devices .etc all with the latest 2013 data on the growth of mobile… The infographic was created by the guys at Super Monitoring.
Mobile Industry Statistics - Digby. 7 reasons why your mobile app gets uninstalled. In case you are wondering, that’s a mayfly.

It usually gets to live for only one day. Quite a number of mobile apps are like mayflies. According to a study by analytics firm Localytics in 2011, 26 percent of apps downloaded were used only once. I know it’s a sinking feeling. An awful experience shared by most newbie developers. You spend hundreds of dollars on app store optimization. . … and BAM! You are NO longer on his phone. We wanted to find out the reasons that compel a user to uninstall an app. . #7. Okay, social logins were a good alternative to registration pages. .
#6. Users Have Low Tolerance For Buggy Apps – Only 16% Will Try A Failing App More Than Twice. The mobile app ecosystem isn’t poised to decline any time soon, according to a new study from Compuware, which finds that the majority of smartphone users (85 percent) still prefer mobile apps to mobile websites.
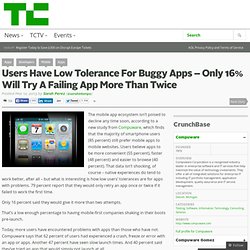
Users believe apps to be more convenient (55 percent), faster (48 percent) and easier to browse (40 percent). That data isn’t shocking, of course – native experiences do tend to work better, after all – but what is interesting is how low users’ tolerances are for apps with problems. 79 percent report that they would only retry an app once or twice if it failed to work the first time. Only 16 percent said they would give it more than two attempts. That’s a low enough percentage to having mobile-first companies shaking in their boots pre-launch. Today, more users have encountered problems with apps than those who have not. To get this data, Compuware commissioned a study with Equation Reach who surveyed 3,534 total respondents across the U.S.