
PeerJ Collection: Practical Data Science for Stats. The "Practical Data Science for Stats" Collection contains preprints focusing on the practical side of data science workflows and statistical analysis.
Curated by Jennifer Bryan and Hadley Wickham. There are many aspects of day-to-day analytical work that are almost absent from the conventional statistics literature and curriculum. And yet these activities account for a considerable share of the time and effort of data analysts and applied statisticians. The goal of this collection is to increase the visibility and adoption of modern data analytical workflows. We aim to facilitate the transfer of tools and frameworks - between industry and academia - between software engineering and Stats/CS - across different domains While these preprints have not been reviewed by PeerJ, they have been reviewed for content by the editors listed above and peers.
100 Savvy Sites on Statistics and Quantitative Analysis. Nate Silver’s unprecedented accurate prediction of state-by-state election results in the most recent presidential race was a watershed moment for the public awareness of statistics.
While data gathering and analysis has become a massive industry in the past decade, it hasn’t always been as well covered in the press or publicly accessible as it is now. With more and more of our daily interactions being mediated through computers and the internet, it is easier than ever to gather detailed quantitative data and do statistical analysis on that data derive valuable information and predictions from it. Data comics. My advise on what you need to do to become a data scientist. Good Problems To Solve In Data Science. Thoughts on statistical consulting. The Statistics Department at UW-Madison has a course on statistical consulting, offered each semester.
I’m often asked to give a lecture, which I do in an informal way: summarizing my experiences and answering questions. I thought it might be useful write my thoughts on statistical consulting here: why, how, and difficulties. This will be a bit rough, and long. Interview with Nick Chamandy, statistician at Google. Nick Chamandy Nick Chamandy received his M.S. in statistics from the University of Chicago, his Ph.D. in statistics at McGill University and joined Google as a statistician.
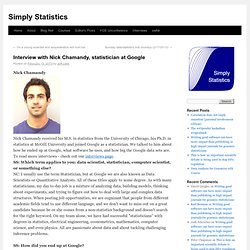
We talked to him about how he ended up at Google, what software he uses, and how big the Google data sets are. To read more interviews - check out our interviews page. SS: Which term applies to you: data scientist, statistician, computer scientist, or something else? NC: I usually use the term Statistician, but at Google we are also known as Data Scientists or Quantitative Analysts. SS: How did you end up at Google? Coming out of my PhD program at McGill, I was somewhat on the fence about the academia vs. industry decision. SS: Is your work related to the work you did as a Ph.D. student? What the Fox Knows. FiveThirtyEight is a data journalism organization.
Let me explain what we mean by that, and why we think the intersection of data and journalism is so important. If you’re a casual reader of FiveThirtyEight, you may associate us with election forecasting, and in particular with the 2012 presidential election, when our election model “called” 50 out of 50 states right. Certainly we had a good night. Stories on Data Science and Analytics. Hadley Wickham has recently joined Rstudio as Chief Scientist.
Previously, he spent over four years as a statistics professor at Rice University. Hadley considers himself primarily a tool-builder for data scientists working in R. He is interested in tools that reduce the cognitive burden of solving data science problems. He likes to figure out good ways to think about problems, then match up cognitive tools with computational tools that make it easy to solve real problems. Hadley Wickham: Impact the world by being useful. Hadley Wickham writes: The best way to impact the world as a data scientist or statistician is to be useful.
This column gives my advice on being useful: • Write code • Work in the open • Teach • Tell the world (There are lots of other ways to be useful, but this is my path.) Write code Every modern statistical and data analysis problem needs code to solve it. You shouldn’t learn just the basics of programming, spend some time gaining mastery. Interview with Hadley Wickham. I recently interviewed Hadley Wickham the creator of Ggplot2 and a famous R Stats person.
He works for RStudio and his job is to work on Open Source software aimed at Data Geeks. Do doctors understand test results? 6 July 2014Last updated at 19:04 ET By William Kremer BBC World Service Are doctors confused by statistics?
A new book by one prominent statistician says they are - and that this makes it hard for patients to make informed decisions about treatment. In 1992, shortly after Gerd Gigerenzer moved to Chicago, he took his six-year-old daughter to the dentist. She didn't have toothache, but he thought it was about time she got acquainted with the routine of sitting in the big reclining chair and being prodded with pointy objects. The clinic had other ideas. What is your 'effective age'? How old are you?
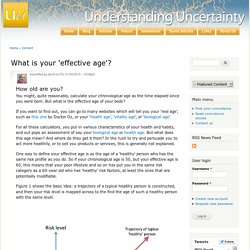
You might, quite reasonably, calculate your chronological age as the time elapsed since you were born. But what is the effective age of your body? If you want to find out, you can go to many websites which will tell you your ‘real age’, such as this one by Doctor Oz, or your 'health age', ‘vitality age’, or ‘biological age’. For all these calculators, you put in various characteristics of your health and habits, and out pops an assessment of say your biological age or health age. But what does this age mean? One way to define your effective age is as the age of a ‘healthy’ person who has the same risk profile as you do. Figure 1 shows the basic idea: a trajectory of a typical healthy person is constructed, and then your risk level is mapped across to the find the age of such a healthy person with the same level. Figure 1. Sometimes the formal basis for these calculations is provided.
How old are your organs? The same idea can be used for individual bits of your body. Why the Quantified Will Inherit the Earth. I"m the co-founder of Koalify, a personal analytics startup. Check out www.koalify.com to start improving your life with personal analytics today. Someone I respect told me “it’s easier to sell painkillers than vitamins.” He’s right, but it’s also an oversimplification. Today’s skipped vitamins are tomorrow’s painkillers – just ask retail execs who didn’t take big data seriously during the rise of Walmart. My data is bigger than yours. Analyzing the fragility of BigData with Nassim N. Taleb. Gil Press (BigData guru writing for Forbes) as well as others [1][2] [3] have recently suggested that organizations can become Antifragile (gain from disorder) by adopting a BigData strategy. The concept of Antifragility has been described at length by Nassim Nicholas Taleb [1] in his brilliant book. For those who are new to the subject of Antifragility here is a video summary where Taleb gives a general overview: Now in the context of BigData, it seems both Gil Press as well as many other marketing departments operating in the name of BigData product vendors, have completely misunderstood the concept of Antifragility.
How odd is a cluster of plane accidents? Statistics is the least important part of data science. A world without statistics. A reporter asked me for a quote regarding the importance of statistics. But, after thinking about it for a moment, I decided that statistics isn’t so important at all. A world without statistics wouldn’t be much different from the world we have now. What would be missing, in a world without statistics? Science would be pretty much ok. Newton didn’t need statistics for his theories of gravity, motion, and light, nor did Einstein need statistics for the theory of relativity. At a more applied level, statistics helped to win World War 2, most notably in cracking the Enigma code but also in various operations-research efforts.
You Don’t Need a Data Scientist, You Need a Data Culture. Most of the larger non-profit organizations we work with are scrambling to figure out how to deploy complex technologies like machine learning and “AI” in service of the social good. These include inspiring examples that range from poverty alleviation, to home fire prevention, to self-harm risk reduction. These stories have spread widely and have come to define what a data-centric organization should be doing – namely complicated data science.
However, if you’re an organization thinking about how to use data better, this is not where you should start. You don’t need a data scientist, you need a data culture. Catherine D’Ignazio and I have built the DataBasic.io tools to focus on helping people creatively build their data literacy. A heuristic for sorting science stories in the news. Dominic Lawson's article in the Sunday Times today[paywall] quotes me as having the rather cynical heuristic: "the very fact that a piece of health research appears in the papers indicates that it is nonsense. " I stand by this, but after a bit more consideration I would like to suggest a slightly more refined version for dealing with science stories in the news, particularly medical ones.
How computer analysts took over at Britain's top football clubs. What it means to be a statistician, according to Lord Claus Moser. In the second part of our interview with Lord Claus Moser, he talks in greater depth about the many issues in the world of statistics and politics which continue to keep him occupied.
Reproducible randomized controlled trials. Ten commandments for good data management. R generation - Significance. Those who can, teach statistics. The phrase I despise more than any in popular use (and believe me there are many contenders) is “Those who can, do, and those who can’t, teach.” Teaching statistical report-writing. Is statistical enquiry a cycle? How to study statistics (Part 1) Difficult concepts in statistics. Parts and whole. Context – if it isn’t fun… Teaching Confidence Intervals. Probability and Deity.
What does it mean to understand statistics? Data for teaching – real, fake, fictional. Why people hate statistics. Mind the gap. The problem with videos for teaching maths and stats. Conceptual knowledge and procedural fluency when teaching maths and stats. My Early Career Crisis (2014 - 2015) - A painful transition of a fresh PhD from academia to industry, and from selfish open-source to product-oriented open-source. I’m (not) looking for a job.