
A Visual Intro to Hierarchical Models. It's reasonable to image that the most realistic situation is a combination of the scenarios described above: Faculty salaries start at different levels and increase at different rates depending on their department.
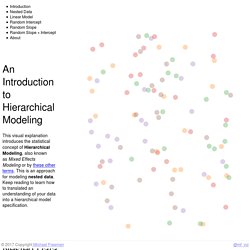
To incorporate both of these realities into our model, we want both the slope and the intercept to vary depending on the department of the faculty member. We can describe this with the following notation: yi^=αj[i]+βj[i]xi Thus, the starting salary for faculty member i depends on their department (αj[i]), and their annual raise also varies by department (βj[i] salaryi^=β0j[i]+β1j[i]∗experiencei In order to implement any of these methods, you'll need to have a strong understanding of the phenomenon you're modeling, and how that is captured in the data.
Guide to Mixed Models in R. I created this guide so that students can learn about important statistical concepts while remaining firmly grounded in the programming required to use statistical tests on real data.
I want this to be a guide students can keep open in one window while running R in another window, because it is directly relevant to their work. In that spirit of openness and relevance, note that I created this guide in R v 3.1.0 and used the following packages: car v 2.0 MASS v 7.3 lme4 v 1.1 mlmRev v 1.0 agridat v 1.8 MCMCglmm v 2.19 ggplot2 v 0.9.3.1 scapeMCMC v 1.1 A mixed model is similar in many ways to a linear model. It estimates the effects of one or more explanatory variables on a response variable. Linear mixed models. [Nlme-help] model.matrix. Jose Pinheiro (jcp@rice.research.bell-labs.com)Thu, 19 Aug 1999 12:08:38 -0400 > I would like to extract the model matrix of a lme or nlme object but> I can't quite figure out how.
![[Nlme-help] model.matrix](http://cdn.pearltrees.com/s/pic/th/nlme3-nlme-help-model-matrix-47817082)
There are different model matrices in an lme model: one for the fixed effects and another for the random effects. I am not sure what you mean by the model matrix for an nlme model. For storage reasons, the model matrices are not saved with an lme object. You can generated them from the fitted object, but you need to be careful to use the data actually used in the fit and the make sure that the parameterization used to represent factors is the same as the one used in the fit (this is specified using the "contrasts" argument to the options() function).
For example, if you fit the model > fmOrth <- lme(distance ~ age * Sex, Orthodont, random = ~ age) with the contrasts > options()$contrasts factor ordered "contr.helmert" "contr.poly" you can get the regression matrix for the fixed effects using Hope this helps, --Jose' How to interpret variance and correlation of random effects in a mixed-effects model?
R - How to get coefficients and their confidence intervals in mixed effects models. CIs for prediction in GLMMs. Difficulty with lme. Kevin Wright > > Generally, the only way to estimate f1:f2 is if you have all combinations of > data present for these two factors.

Well, he said it was unbalanced, he didn't say how unbalanced -- i.e. it's not clear (to me) whether there are any completely missing cells or not ... Getting Started with Mixed Effect Models in R. Analysts dealing with grouped data and complex hierarchical structures in their data ranging from measurements nested within participants, to counties nested within states or students nested within classrooms often find themselves in need of modeling tools to reflect this structure of their data.
In R there are two predominant ways to fit multilevel models that account for such structure in the data. These tutorials will show the user how to use both the lme4 package in R to fit linear and nonlinear mixed effect models, and to use rstan to fit fully Bayesian multilevel models. The focus here will be on how to fit the models in R and not the theory behind the models. For background on multilevel modeling, see the references. [1] P-values from random effects linear regression models. A simple simulation of Hierarchical Linear Modelling (HLM) using two different R packages - intercept only RE. [R-sig-ME] Questions about using glmmPQL and glmer.
Logistic random effects regression models: a comparison of statistical packages for binary and ordinal outcomes. What is the difference between generalized estimating equations and GLMM? Questions on the results from glmmPQL(MASS) Package comparison - GLMM. DRAFT r-sig-mixed-models FAQ - GLMM. This is a tentative draft of a FAQ list for the r-sig-mixed-models mailing list (the mailing list is at r-sig-mixed-models@r-project.org, with Gmane archives available as well).

The most commonly used functions for mixed modeling in R are linear mixed models: aov(), nlme::lme, lme4::lmer;generalized linear mixed models (GLMMs): MASS::glmmPQL, lme4::glmer, MCMCglmm::MCMCglmm;nonlinear mixed models: nlme::nlme, lme4::nlmer. (G)LMMs are hard - harder than you may think based on what you may have learned in your second statistics class, which probably focused on picking the appropriate sums of squares terms and degrees of freedom for the numerator and denominator of an F test.
‘Modern’ mixed model approaches, which are much more powerful (they can handle complex designs, lack of balance, crossed random factors, some kinds of non-normally distributed responses, etc.), also require a new set of conceptual tools. GAMMs: Studying Pronunciation Changes (Slides) GAMM4 CHOLMOD error. Using Generalised Additive Mixed Models (GAMMs) to Predict Visitors to Edinburgh and Craigmillar Castles. Skip to content Technical blog from our Data Science Team Read the latest technical blogs from our data science team.

Back to all technical blogs» Using Generalised Additive Mixed Models (GAMMs) to Predict Visitors to Edinburgh and Craigmillar Castles July 16, 2019 Author: Caterina Constantinescu I’d been curious about generalised additive (mixed) models for some time, and the opportunity to learn more about them finally presented itself when a new project came my way, as part of my work at The Data Lab. By understand the pattern of visitors, I really mean predict it on the basis of several ‘reasonable’ predictor variables (which I will detail a bit later). We will begin our discussion by first having a quick look at the data available. The data.