
Infographics & Data Visualizations. Visual Thinking/Visual Computing- Resources. Thinkmap Visual Thesaurus - An online thesaurus and dictionary of over 145,000 words that you explore using an interactive map. Data Visualization and Infographics - Smashing Magazine. Advertisement The main goal of data visualization is its ability to visualize data, communicating information clearly and effectivelty.
It doesn’t mean that data visualization needs to look boring to be functional or extremely sophisticated to look beautiful. To convey ideas effectively, both aesthetic form and functionality need to go hand in hand, providing insights into a rather sparse and complex data set by communicating its key-aspects in a more intuitive way. Yet designers often tend to discard the balance between design and function, creating gorgeous data visualizations which fail to serve its main purpose — communicate information. In both print and web design infographics — visual representations of information, data or knowledge — are often used to support information, strengthen it and present it within a provoking and sensitive context, depending on designer’s creativity. VocabGrabber.
Information aesthetics - Data Visualization & Information Design. Data Visualization Framework. Visuwords™ online graphical dictionary and thesaurus. Ideas, issues, knowledge, data - visualized! Infographics & Visualizations. Create, Share, Explore. Data Visualization, Infographics, and Statistics. Many Eyes. Free data visualisation tool. In decision making, getting and analysing the right data is critical.
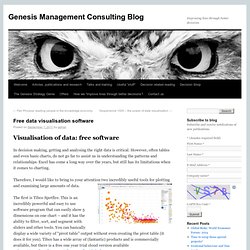
However, often tables and even basic charts, do not go far to assist us in understanding the patterns and relationships. Excel has come a long way over the years, but still has its limitations when it comes to charting. Therefore, I would like to bring to your attention two incredibly useful tools for plotting and examining large amounts of data. SEO Keyword Graph Visualization. Use this free Java application to explore the connections between related websites.
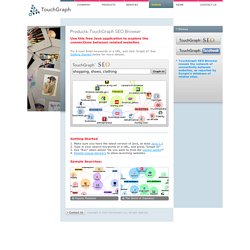
Try it now! Enter keywords or a URL, and click 'Graph it! ' All you need to know about Visual Thinking. Visualizing Meaning » About the project. A Periodic Table of Visualization Methods.