

Delightful JavaScript Charts for your web & mobile apps. Morris.js. Getting started Add morris.js and its dependencies (jQuery & Raphaël) to your page. 1 <link rel="stylesheet" href=" <script src="//ajax.googleapis.com/ajax/libs/jquery/1.9.0/jquery.min.js"></script>3 <script src="//cdnjs.cloudflare.com/ajax/libs/raphael/2.1.0/raphael-min.js"></script>4 <script src=" If you don’t want to use the CDN-hosted assets, then you can extract them from the zip bundle and upload them to your own site.
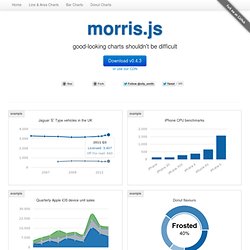
Your first chart Start by adding a <div> to your page that will contain your chart. Note: in order to display something, you’ll need to have given the div some dimensions. Next add a <script> block to the end of your page, containing the following javascript code: Assuming everything’s working correctly, you should see the following chart on your page: What Next? Check out the rest of the documentation: Also, check out Ryan Bates’ excellent RailsCast #223 Graphs and Charts (note: requires subscription). License. Cross-Browser JavaScript/HTML5 Charts - dhtmlxChart. DhtmlxChart is a JavaScript charting library for generating cross-browser HTML5 charts.
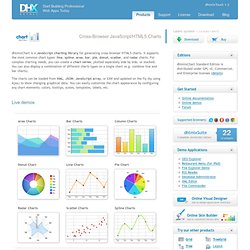
It supports the most common chart types: line, spline, area, bar, pie, donut, scatter, and radar charts. For complex charting needs, you can create a chart series, plotted separately side by side, or stacked. You can also display a combination of different charts types on a single chart (e.g. combine line and bar charts). The charts can be loaded from XML, JSON, JavaScript array, or CSV and updated on the fly (by using Ajax) to show changing graphical data. You can easily customize the chart appearance by configuring any chart elements: colors, tooltips, scales, templates, labels, etc. Live demos. Chart Tools. Smoothie Charts: A JavaScript Charting Library for Streaming Data. Gantt - Editable JavaScript DHTML Gantt Chart with Rich API. DhtmlxGantt is an open source JavaScript Gantt chart that helps you visualize a project schedule in a nice-looking chart.
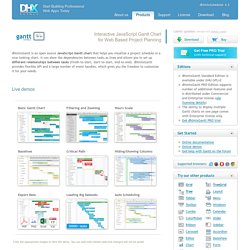
It can show the dependencies between tasks as lines and allows you to set up different relationships between tasks (finish-to-start, start-to-start, end-to-end). dhtmlxGantt provides flexible API and a large number of event handles, which gives you the freedom to customize it for your needs. Basic Gantt Chart Filtering and Zooming Hours Scale Baselines Critical Path Hiding/Showing Columns Export Data Loading Big Datasets Auto Scheduling Click the appropriate images to view the demo. Features Note that some features are available in the PRO Edition only. Easy Initialization With dhtmlxGantt, you can create a comprehensive tool for visual project management and provide the end users with a convenient way to schedule their activities. Fully Customizable Intuitive User Interface Rich Feature Set Export to PDF and PNG By default, the generated PDF/PNG document includes a watermark.
RGraph - Free HTML5 and JavaScript charts. Humble finance - html5 visualization. HumbleFinance is an HTML5 data visualization tool written as a demonstration of interactive graphing in HTML5.
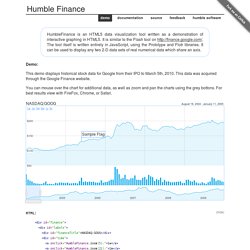
It is similar to the Flash tool on The tool itself is written entirely in JavaScript, using the Prototype and Flotr libraries. It can be used to display any two 2-D data sets of real numerical data which share an axis. Demo: This demo displays historical stock data for Google from their IPO to March 5th, 2010. This data was acquired through the Google Finance website. You can mouse over the chart for additional data, as well as zoom and pan the charts using the grey bottons. August 19, 2004 - January 11, 2005 HTML: (hide) JavaScript InfoVis Toolkit. Arbor.js. AwesomeChartJS. Description AwesomeChartJS is a simple Javascript library that can be used to create charts based on the HTML 5 canvas element.
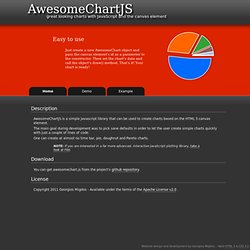
The main goal during development was to pick sane defaults in order to let the user create simple charts quickly with just a couple of lines of code. One can create at almost no time bar, pie, doughnut and Pareto charts. NOTE: If you are interested in a far more advanced, interactive JavaScript plotting library, take a look at Flot. Download You can get awesomechart.js from the project's github repository. License Copyright 2011 Georgios Migdos - Available under the terms of the Apache License v2.0 . Example Let's say we want to create a bar chart for the following data: Product Sales - 2010 Desktops: 1532 Laptops: 3251 Netbooks: 3460 Tablets: 1180 Smartphones: 6543 First, we have to define a canvas element in our html document: <canvas id="canvas1" width="300" height="300"> Your web-browser does not support the HTML 5 canvas element.
This is the result: Highcharts - Interactive JavaScript charts for your webpage. JS Charts - Free JavaScript charts. HTML5 Charts for your website. Elycharts.