
Mind map software built with teams in mind - Mind map online. Site organiza mapas de estudo para os mais diversos campos do conhecimento. Você quer aprender mais sobre ciência da computação?
Ou talvez sobre design? Economia? Empreendedorismo? Agricultura... Todos esses campos do conhecimento humano são contemplados no site Learn Anything, um repositório de cursos, livros e outras fontes de aprendizado online. A diferença deste site para outros compilados de tutoriais é que ele inclui mapas mentais, guias visuais de fluxo de aprendizado, desenhados e curados pela própria comunidade. Cada tópico possui seu próprio mapa mental, e cada item desse mapa é associado a links para o respectivo material de estudo. Alguns assuntos têm guias mais completos do que outros, mas como o site é colaborativo, pode ser uma questão de tempo para a comunidade torná-lo ainda mais útil e rico em referências. Interessou? A Very Good Tool to Create Charts from Spreadsheets and Insert Them into Google docs. February 25, 2015 The Charts Builder is a Google Docs add-on that we have discovered while we were curating google Forms Tools for Teachers.
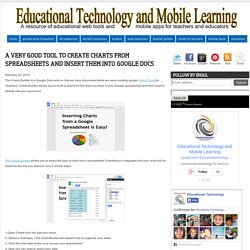
Charts Builder allows you to build a chart from the data you have in your Google spreadsheet and then insert it directly into your document. The Charts Builder allows you to select the type of chart and a spreadsheet. Everything is integrated and your chart will be added to the line you select in only 5 simple steps: 1-Open Charts from the add-ons menu 2- Select a chart type. (The Chart Builder will explain how to organize your data) 3- Click the load data button and choose your spreadsheet 4- Now you can drag to select your data 5- That’s it; just click the Insert button.
10 free tools for creating infographics. Done right, infographics can be a great way to make sense of complex data.
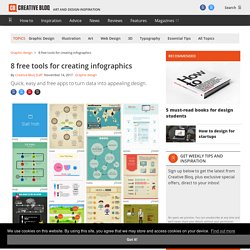
The best infographics transform complex information and data into graphics that are both easy to grasp and visually appealing. The only problem is, infographics that look like they were simple to make are often anything but. Exclusive offer: Save 15% on Adobe Creative Cloud now Here, we've selected our top free tools and apps for making infographics. Some of the options here are even suitable for non-designers, as templates and other features make them easy to use.
Give these free tools a try and let us know which ones you get on best with on Facebook or Twitter. 01. Visme promises to help you 'speak visually'. Creando infografías desde Google Drawing. Organizing the Move with Springpad. E-Learning Theories & Methodologies - Paul's E-Learning Resources. Mind Maps & Other Brainstorming Tools. Remixando brinquedos: Free Universal Construction Kit - Daniela Kutschat. The Free Universal Construction Kit é um conjunto de 80 peças adaptadoras que permitem a interoperabilidade entre vários tipos de brinquedos de montar produzidos por diferentes fabricantes.
Qualquer pessoa pode produzir as peças por um baixo custo usando uma impressora 3D. Os modelos digitais das peças são disponibilizados gratuitamente no site do projeto ou no Thingiverse.com, e todo o material é distribuido por uma licença de direitos autorais aberta Creative Commons. O kit permite que a criança explore melhor o seu potencial criativo ao facilitar a interligação de uma peça a qualquer outra, integrando diferentes sistemas de brinquedos. Há uma diversificação das possibilidades construtivas ao invés do número limitado de combinações de um sistema fechado. A iniciativa do projeto é do F.A.T. Referências SCRIPTed – A Journal of Law, Technology & SocietyThe Intellectual Property Implications of Low-Cost 3D Printing por Simon Bradshaw, Adrian Bowyer° and Patrick Haufe. Free online speed reading software.
Estude Online Grátis- ExamTime Brasil. Moodle.org: open-source community-based tools for learning.
Flashcards. Op-Ed Contributor - Scientifically Tested Tests. Online Mind Mapping and Brainstorming app - SpiderScribe. 40 Useful and Creative Infographics. Six Revisions Menu Main Categories CSS HTML JavaScript Web Design WordPress Web Development Design Inspiration UX Design UI Design Freebies Tutorials Tools Links About Contact Advertise RSS Twitter Facebook 40 Useful and Creative Infographics By Jacob Gube Information graphics (or infographics) are graphical depictions of data and information.
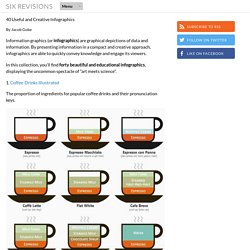
In this collection, you’ll find forty beautiful and educational infographics, displaying the uncommon spectacle of "art meets science". 1. The proportion of ingredients for popular coffee drinks and their pronunciation keys. 2. This infographic showcases the history of the Swine Flu, starting from 1976. 3. 4. 5. The top breweries and beers in the U.S. APRENDIZAGENS 2.0. Aprendizado de idioma com Livemocha. 12 Dozen Places To Educate Yourself Online For Free.