
The Agas Map Our new (as of the beginning of 2015) implementation of the Agas Map is based on the OpenLayers 3.0 library. It presents the map as a zoomable, rotatable tiled image with several hundred locations plotted on it. In the default view, the locations are initially hidden; you can show them by checking checkboxes in the navigation panel which appears at the top right of the map. Locations in the navigation panel are sorted into categories; click on a category name to expand it and see all the locations. Some locations appear in more than one category. Zoom in and out using the scroll wheel on your mouse, or the zoom control at the top left. Apart from this, these are the main things you will want to do with the map: Find one or more specific locations and show them This is best done by searching in the navigation panel. You can also search for a MoEML @xml:id value in the search box, so if you happen to know the id of a location, but not its name, you can find it quickly that way.
Roman Empire GDP Per Capita Map Shows That Romans Were Poorer Than Any Country in 2015 Map by the NEP-HIS Blog, found via Reddit. What a difference 2,000 years makes. The map above shows the GDP per capita in 14AD of the various provinces of the Roman Empire in 1990 PPP Dollars. On average, the GDP per capita across the whole Empire, was only $570. This would make the average Roman in 14AD poorer than the average citizen of every single one of the world’s countries in 2015. Wondering how that’s possible? According to the World Bank, the Democratic Republic of the Congo is currently the world’s poorest nation with GDP per capita in constant 1990 PPP dollars of $766 in 2012. However, as the map above shows GDP per capita varied widely across the Empire. In contrast, the Empire’s poorest provinces were only half as wealthy, which dragged down the average. According to the United States Bureau of Economic Analysis, Delaware has the highest GDP per capita of any state at $61,183 in 2012 vs Mississippi’s much smaller $28,944 or just a little less than half as much. Methodology
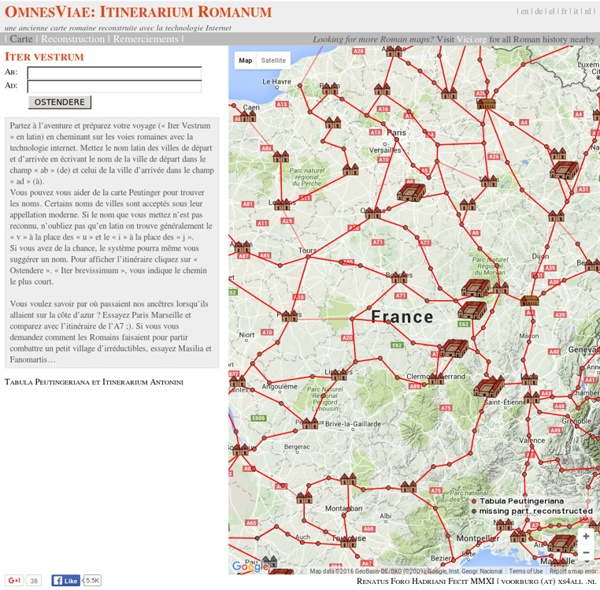
Une Google map de l'Empire romain Des historiens, géographes et informaticiens de l’université de Stanford, qui partagent une même passion pour l’Antiquité, ont créé un logiciel pour le moins insolite : il permet de calculer des itinéraires entre deux villes comme si l’on vivait au temps des Romains. La carte de l’Empire reproduite par les scientifiques est une reproduction fidèle du réseau de transport romain. Elle compte plus de 750 grands lieux de passages, un réseau de 84 000 km, et plus de 900 routes maritimes, selon nos confrères de Science & Vie Junior qui ont repéré la carte. Sélectionnez votre moyen de transport (char à boeufs, dos d’âne ou à pied), la période de l’année prévue pour le départ et l’argent que vous êtes prêt à investir, et c’est parti pour un voyage dans le temps ! Au temps des Romains, et au mois de juin, il fallait ainsi compter plus de 20 jours pour rallier Rome depuis Lugdunum, en se faisant porter par des esclaves et en prenant un bateau depuis Massilia avec une étape en Corse.
Données publiques ouvertes, les réutilisations du MENESR Depuis le 24 avril 2014, le Ministère de l’Éducation nationale, de l’Enseignement supérieur et de la Recherche (MENESR) anime la première plate-forme Open Data ministérielle. Pour faciliter la mise à disposition de ses données sur l’enseignement supérieur et la recherche, le MENESR s’est associé à OpenDataSoft, dont les performances techniques ont facilité l’ouverture des données publiques. Extrait du dossier de presse réalisé pour l’ouverture de la plateforme Open Data Enseignement supérieur et Recherche : “Le ministère a choisi la jeune start-up française OpenDataSoft, spécialisée dans le traitement et la publication de données en ligne, pour la mise en œuvre de son service d’accès aux données libres sur l’enseignement supérieur et la recherche. Performance technique, ergonomie, facilité de déploiement et maîtrise des coûts sont à l’origine de ce choix.” Chez OpenDataSoft, une de nos missions est d’optimiser la diffusion, l’accès et la réutilisation des données.
Pomponius Mela Reconstruction of Pomponius Mela's world map by Konrad Miller (1898). Pomponius Mela's description of Europe (F. Nansen, 1911). Pomponius Mela, who wrote around AD 43, was the earliest Roman geographer. His short work (De situ orbis libri III.) occupies less than one hundred pages of ordinary print. Biography[edit] Little is known of the author except his name and birthplace—the small town of Tingentera or Cingentera in southern Spain, on Algeciras Bay (Mela ii. 6, § 96; but the text is here corrupt). Geographical knowledge[edit] The general views of the De situ orbis mainly agree with those current among Greek writers from Eratosthenes to Strabo; the latter was probably unknown to Mela. The shores of Codanus sinus (southwestern Baltic Sea) in red with its many islands in green. Descriptive method[edit] Mela's descriptive method follows ocean coasts, in the manner of a periplus, probably because it was derived from the accounts of navigators. Editions[edit] References[edit] Pomponius Mela's.
La table de Peutinger La table de Peutinger (Document et commentaires adressés par Sébastien Périaux) Pour agrandir la partie qui correspond à la Normandie, cliquez sur la carte. Voici un extrait de la Table de Peutinger pour la partie occidentale de la Gaule. On y distingue Rotomagus (Rouen), Gravinum (Grainville-la-Teinturière) ou peut-être plus exactement Greaume (à Héricourt-en-Caux) suivant les derniers résultats des fouilles. La table de Peutinger est l'ancêtre des cartes routières. Elle mesure plus de 6 mètres de long et 30 cm de large. C'est une carte routière qui représente les principales routes de l'ensemble de l'empire romain. Elle contient quelques erreurs et inexactitudes...
Interactive: When Do Americans Leave For Work? JavaScript required for interaction.<br /><img src=" In a continued dig into commute data from the American Community Survey (We already saw mode of transportation.), the map above shows when people leave home for work. The rates are for people who have jobs and are 16 years or older. The data does not include people who work from home. Do we get anything interesting even though it's just one facet of the commute to work? As you'd expect, many commuters leave home between 7:00am and 8:00am. This surprised me. In contrast, commuters are more spread out between 7:00am and 8:30am in other areas. Still, fairly normal. Look at commuting rates during the late night and early morning hours. LaGrange county in Indiana, known for its large Amish population, also has many leave for work during the midnight to 4:59am time slot.
The Romans: From Village to Empire (2nd edition; 2011) | Ancient World Mapping Center A second edition of Mary T. Boatwright, Daniel J. Gargola, Noel Lenski, Richard J. The maps below were originally created by the Ancient World Mapping Center. Map 1.1 Archaic Italy [Full-size .pdf version] Map 1.2 Southern Italy and Sicily [Full-size .pdf version] Map 1.3 Northern Italy [Full-size .pdf version] Map 1.4 Rome and Environs [Full-size .pdf version] Map 1.5 Rome in the Early Republic (before 300 B.C.) Map 2.1 Latium and Southern Etruria [Full-size .pdf version] Map 2.2 Latium and Campania [Full-size .pdf version] Map 2.3 Samnium [Full-size .pdf version] Map 2.4 Southern Italy [Full-size .pdf version] Map 3.1 Western Mediterranean in the Mid-Third Century [Full-size .pdf version] Map 3.2 Northern Italy [Full-size .pdf version] Map 3.3 Southern Italy and Sicily [Full-size .pdf version] Map 3.4 Iberian Peninsula [Full-size .pdf version] Map 3.5 Greece, the Aegean, and Western Asia Minor [Full-size .pdf version] Map 5.1 Rome’s Foreign Wars, 113-82 [Full-size .pdf version] Map 5.2 Social War
Maquette de Rome,Rím,modelo de Roma,modell av Roma,malli Rooman,modell av Rom,Roma modeli Cartography of the Anthropocene - Globaïa The Anthropocene: A primer. The Anthropocene. We’re already there. This is our time, our creation, our challenge. Officially, this epoch does not exist. Yet. Unofficially however, the term is used more frequently in the scientific literature and, more recently, in publications dedicated to the general public. So, might you ask, what is the Anthropocene? First, the etymology. The term was proposed in 2000 by Paul J. Technically, the Anthropocene is the most recent period of the Quaternary, succeding to the Holocene. The Pleistocene (2.588 Ma to 11.7 Ka) was a tumultuous era, during which more than eleven major glaciations occurred. The Holocene (11.7 ka until about 1800 AD) was a time comparatively smoother in terms of climate variability. We are officially still in the Holocene. We collectively rolled over into a new era, which includes its stakes and challenges but also its opportunities and great qualities. Mapping the Anthropocene: first few steps. Comments?
l'impero romano, altrove quanto era grande l'impero romano? beh, abbastanza... prendiamo l'apice dell'estensione territoriale dell'impero, sotto l'imperatore Traiano nel 117 d.C. una mappa ben conosciuta, direi. beh, adesso spostiamo l'impero in altri continenti e vediamo i risultati... SUD AMERICA! niente male! andiamo da Panama all'Uruguay!! AFRICA! AMERICA DEL NORD! dall'Iran a Taiwan! OCEANIA!