
If the World were 100 PEOPLE 50 would be female 50 would be male 26 would be children There would be 74 adults, 8 of whom would be 65 and olderThere would be: 60 Asians 15 Africans 14 people from the Americas 11 Europeans33 Christians 22 Muslims 14 Hindus 7 Buddhists 12 people who practice other religions 12 people who would not be aligned with a religion12 would speak Chinese 5 would speak Spanish 5 would speak English 3 would speak Arabic 3 would speak Hindi 3 would speak Bengali 3 would speak Portuguese 2 would speak Russian 2 would speak Japanese 62 would speak other languages83 would be able to read and write; 17 would not 7 would have a college degree 22 would own or share a computer77 people would have a place to shelter themfrom the wind and the rain, but 23 would not 1 would be dying of starvation 15 would be undernourished 21 would be overweight 87 would have access to safe drinking water 13 people would have no clean, safe water to drink
Map Explorer Explore maps of future climate as simulated by individual climate models. IMPORTANT: When viewing and using results from individual climate models, it is imperative that you also take account of the range in the climate projections. If you have not already done so, we encourage you to use the Climate Futures approach to identify two or three models that capture the range of results relevant to your application. More information can be found in the Climate Campus here . Initially, the map shows just the four NRM Super-Clusters . Users who wish to see maps of multi-model results should refer to the Technical Report and Cluster Reports . Get Started 1. 2. 3. 4. 5. 6. 7. 8. Navigating and Reading the Map The gridded results corresponding to your settings are displayed on the map. The map can be zoomed using the + and - buttons. The legend to the right of the map shows the colour scale used to display the results as well as the units. Configure Data Configure View Map View Options Save & Export 1.
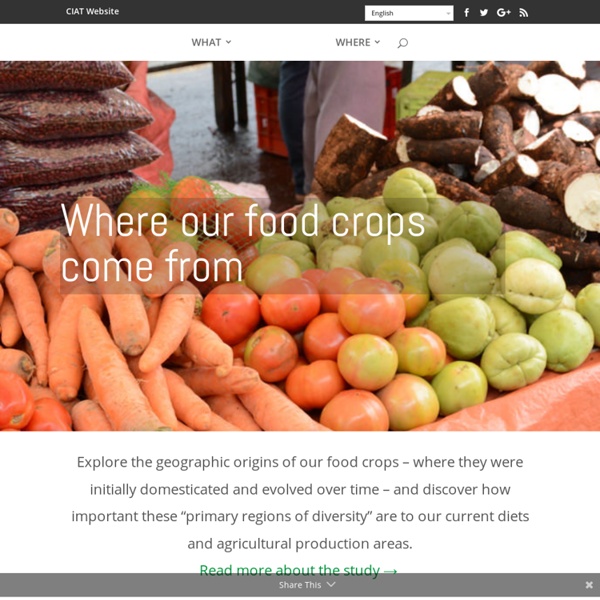
Insécurité alimentaire et changement climatique (FAO) Background science This website allows you to explore how different scenarios of global greenhouse gas emissions and adaptation to climate change could change the geography of food insecurity in developing and least-developed countries. The website maps an index of vulnerability to food insecurity at national level. This is calculated based on exposure to climate-related hazards, sensitivity of agricultural production to those hazards, and the capacity of countries to cope with climate-related food shocks. By altering the levels of future global greenhouse gas emissions and/or the levels of adaptation, you can see how vulnerability to food insecurity changes over time, and compare and contrast these different future scenarios with each other and the present day. Vulnerability to food insecurity in the present-day The climate and food insecurity index shown on this website is a measure of vulnerability of the food system to climate-related hazards. Exposure Sensitivity Adaptive capacity
40 Maps They Didn’t Teach You In School By the time we graduate high school, we learn that they never taught us the most interesting things in there. Sure, you might be able to name the European countries or point New York on the map, but does that give a you real understanding of how the world functions? To fill this gap, we have gathered a great and informative selection of infographical maps that they should’ve shown us at school: every single one of these maps reveals different fun and interesting facts, which can actually help you draw some pretty interesting conclusions. Show Full Text What makes infographical maps so engaging is how easy it becomes to conceive graphically presented information. Without further ado, we invite you to learn things like most popular sports in different countries, who has the largest breasts, red hair map of Europe, world’s most consumed alcoholic beverages, or which brands dominate in different states of the USA. Trust us, these are way better than the ones they taught you at school!
How terrorism in the West compares to terrorism everywhere else - Washington Post L'Indice FAO des prix alimentaires affiche son plus fort recul depuis décembre 2008 10 septembre 2015 – Les cours internationaux des denrées alimentaires ont continué à fléchir en août, tandis que les disponibilités abondantes, la chute des prix de l'énergie et les inquiétudes au sujet de la récession économique en Chine ont concouru à la plus forte baisse de l'Indice FAO des prix alimentaires en près de sept ans. L'indice avoisinait les 155,7 points en août 2015, en repli de 5,2% par rapport à juillet et la baisse mensuelle la plus importante depuis décembre 2008, la quasi-totalité des principaux produits alimentaires accusant des chutes sensibles, a précisé l'Organisation des Nations Unies pour l'alimentation et l'agriculture (FAO). L'Indice FAO des prix alimentaires est un indice pondéré qui mesure la variation mensuelle de cinq catégories principales de denrées alimentaires sur les marchés internationaux: céréales, viande, produits laitiers, huiles végétales et sucre.
The Most Disproportionately Well-Paying Job in Each State 8513 25Share1 Click to enlarge Get rich quick schemes rarely go according to plan, so unfortunately you're going to have to do some work if you want to make it big. Still, if you want to get the most bang for your buck, you might want to check out what state is going to pay you the most for the same job. The Afternoon Map is a semi-regular feature in which we post maps and infographics. November 11, 2015 - 4:25pm ©2016 Mental Floss, Inc. Aurora Australis Viewing Locations ( southern hemisphere ) ABOUTA collated map of aurora australis viewing locations in Australia & New Zealand.The map was established and is overseen by the admins of Facebook group Aurora Australis Tasmania.FYI: In the southern hemisphere we face South to view aurora australis ........( in the northern hemisphere you face North to view aurora borealis ) ==================== DATA LICENSING ====================Please do not collect / disseminate our map location information Please ask for permission if you wish to re-use our informationAs per respective entities======================================================= DISCLAIMER & SAFETY NOTICE:> Care taken but no responsibility is given for the accuracy of the map - locations have been supplied by members of Aurora Australis Tasmania &/or Aurora Australis (New Zealand) facebook groups, who are contributing the location to be suitable for viewing an aurora australis from. !!
MapCrunch - Random Google Street View Climate Action Tracker Global inequalities in population, wealth, and religious origin shown in six maps. This map of Canada shows the country's familiar vastness. A single line drawn across its deep south adds a surprising layer of information. The line runs well below the 49th parallel that constitutes that long straight stretch of U.S.-Canada border from Point Roberts, WA to Lake of the Woods, MN (see also #519). Split in two by the U.S. state of Maine poking north, the line traverses four eastern provinces, cutting off the southern extremities of Ontario, Québec and New Brunswick. Amazingly, what the line does, is divide Canada in two perfect halves – demographically speaking: 50% of Canada's 35 million inhabitants live south of the line, 50% north of it. Canada's three northernmost circumscriptions (Yukon, Northern Territories and Nunavut) cover about 40% of Canada's total area, but only count around 100,000 people (less than 0.3% of the 35-million total). Neither of those statistics brings home the lopsidedness of Canada's population distribution as well as this map. And there's more.