
Global inequalities in population, wealth, and religious origin shown in six maps. This map of Canada shows the country's familiar vastness. A single line drawn across its deep south adds a surprising layer of information. The line runs well below the 49th parallel that constitutes that long straight stretch of U.S.-Canada border from Point Roberts, WA to Lake of the Woods, MN (see also #519). Split in two by the U.S. state of Maine poking north, the line traverses four eastern provinces, cutting off the southern extremities of Ontario, Québec and New Brunswick. Amazingly, what the line does, is divide Canada in two perfect halves – demographically speaking: 50% of Canada's 35 million inhabitants live south of the line, 50% north of it. Canada's three northernmost circumscriptions (Yukon, Northern Territories and Nunavut) cover about 40% of Canada's total area, but only count around 100,000 people (less than 0.3% of the 35-million total). Neither of those statistics brings home the lopsidedness of Canada's population distribution as well as this map. And there's more.
Theory Of Knowledge | Resources For Mr. Ferlazzo's TOK Class Mapping the Affordable Housing Deficit for Each State in the U.S. Every single county in the U.S. lacks affordable housing, and in no state can someone earning a minimum wage salary rent a two-bedroom apartment at market rate. A new report by the National Low Income Housing Coalition paints a fresh, grim picture of this ongoing affordable housing crisis. Using 2014 American Community Survey data, the report’s authors calculated the number of units families earning below 30 percent of the median income in their areas could rent comfortably, without devoting more than 30 percent of their income towards housing. Their count included units that were vacant, as well as those that were occupied by households in the income bracket defined above (called “Extremely Low Income” or ELI families in the report). Overall, the report found that only 31 such units existed for every set of 100 poor families in the U.S. But the national deficit—appalling as it is—masks even more dire housing gaps in several states.
The Lifespan of a Thought Experiment: Do We Still Need the Trolley Problem? A runaway streetcar is hurtling towards five unsuspecting workers. Do you pull a switch to divert the trolley onto another track, where only one man works alone? Or do you do nothing? This haunting choice is a variation of the “trolley problem,” an iconic philosophical thought experiment. Thought experiments have been essential in scholarly discourse since the ancient Greeks and Romans. Curiously, the first thinkers to popularize and analyze the trolley problem were women—in general, rare voices in philosophy. A few years later, Judith Thomson, a philosopher at the Massachusetts Institute of Technology, coined the term “trolley problem” and created what would become its two most famous variants, the “footbridge” and the “switch.” By the late ‘90s, trolley problems had fallen out of fashion. It wasn’t clear trolleys could ever find a life out of the pages of academic journals until one philosophy graduate student, Joshua Greene, revived them with the modern techniques of neuroscience.
667 - Pop! Goes the World: 7.2 Billion and Counting | Strange Maps by Frank Jacobs The world has added over 800 million people over the last decade – a number so vast it is almost meaningless. Unless you convert it to more familiar units of measurement: Four Brazils. Both maps compared here were published on July 11, World Population Day – the first one in 2004, the second one last Friday. World Population Map for 2005 (6.4 billion) The U.N. designated July 11 as a day to 'reflect' on population issues, in commemoration of the fact that humanity passed the 5-billion mark on that date in 1987. World Population Map for 2015 (7.2 billion) Projected population growth between 2005 and 2015 represents an increase of about 12%. Let's zoom in... North America N. This population-based cartogram for 2005 amplifies the dominance of the U.S. (296 million) of the North American continent, and reduces Canada (30 million), geographically larger but demographically much, much smaller, to the status of 'America's Hat (see also #339). N. South America S. S. Europe Africa E.
Monty Python's Best Philosophy Sketches From dead parrots to The Meaning of Life, Monty Python covered a lot of territory. Educated at Oxford and Cambridge, the Pythons made a habit of weaving arcane intellectual references into the silliest of sketches. A classic example is “Mrs. Another classic is the “Philosopher’s Drinking Song,” shown above in a scene from Monty Python Live at the Hollywood Bowl. In the sketch, members of the philosophy department at the “University of Woolloomooloo” lead the audience in singing, “Immanuel Kant was a real pissant who was very rarely stable; Heidegger, Heidegger was a boozy beggar who could think you under the table…” And one of our favorites: “The Philosophers’ Football Match” (above), a filmed sequence from Monty Python Live at the Hollywood Bowl, pitting the Ancient Greeks against the Germans, with Confucius as referee. When you’re done laughing, you can dive deep into philosophy here with our collection of 55 Free Philosophy Courses online.
Origin of crops |click on pic by Colin K. Khoury, Harold A. Achicanoy, Carlos Navarro-Racines, Steven Sotelo, and Andy Jarvis at the International Center for Tropical Agriculture (CIAT). Version 1.0 (May 2016). This work is associated with the publication: Khoury CK, Achicanoy HA, Bjorkman AD, Navarro-Racines C, Guarino L, Flores-Palacios X, Engels JMM, Wiersema JH, Dempewolf H, Sotelo S, Ramírez-Villegas J, Castañeda-Álvarez NP, Fowler C, Jarvis A, Rieseberg LH, and Struik PC (2016). About the circular plots Each region has a color representing its own “native” crops and those colors are connected to other regions due the importance of those crops in the diets/agricultural production in other regions. Methods and code for the plots were derived from The Global Flow of People by Nikola Sander, Guy J. About the data We analyzed data for each crop commodity per country per measurement over the most recent three years for which sufficient data were available (2009-2011).
The map is not the territory. – ToK Trump This lesson is designed to be taught early in a ToK Course. It is designed to encourage students to question the veracity of their reality. It is a classic ToK / Psychology / Philosophy lesson, I include it here as help for teachers who may be new to teaching ToK. Like all lessons posted here you should adapt this so that it is appropriate for your class group. WoKs: Language, Sense Perception, maybe others such as Imagination, Reason etc Learning Intentions: Students understand that there are multiple interpretations of reality.Students understand that reality can be visually presented, yet realities may extend beyond the unitary visual representation.students understand that visual reality can develop to cognitive representation of reality. Some of the lesson ideas here come from my erstwhile ToK teaching colleague Mr Gareth Stevens, check his site out for many other cool ideas. Process. 1. 2. Students then classify their ‘knows’ by WoK. Draw out the contrasts in WoKs. 3. 4. 5. 6. 7. 8.
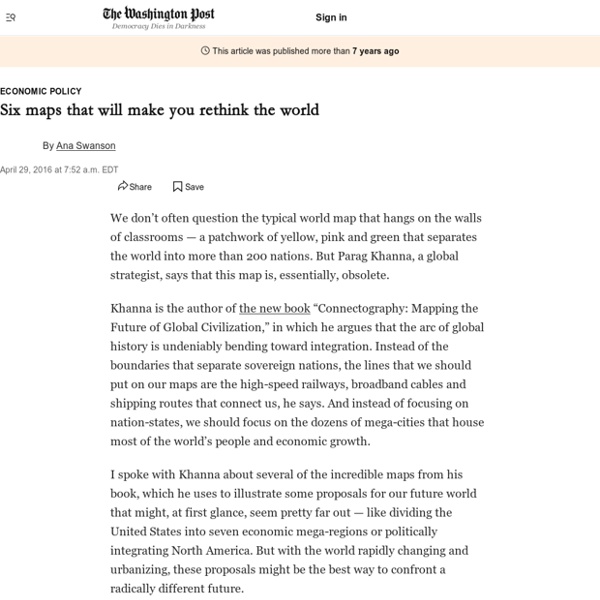
If the World were 100 PEOPLE 50 would be female 50 would be male 26 would be children There would be 74 adults, 8 of whom would be 65 and olderThere would be: 60 Asians 15 Africans 14 people from the Americas 11 Europeans33 Christians 22 Muslims 14 Hindus 7 Buddhists 12 people who practice other religions 12 people who would not be aligned with a religion12 would speak Chinese 5 would speak Spanish 5 would speak English 3 would speak Arabic 3 would speak Hindi 3 would speak Bengali 3 would speak Portuguese 2 would speak Russian 2 would speak Japanese 62 would speak other languages83 would be able to read and write; 17 would not 7 would have a college degree 22 would own or share a computer77 people would have a place to shelter themfrom the wind and the rain, but 23 would not 1 would be dying of starvation 15 would be undernourished 21 would be overweight 87 would have access to safe drinking water 13 people would have no clean, safe water to drink
misleading | Cartastrophe Gentle readers, my apologies for being so long in returning to blogging. Inspiration has sometimes been a bit lacking, and when it wasn’t, time was. But be assured I have no plans to abandon this enterprise without notice, though I may take breaks from time to time. On to today’s main event. 6. I can think of few more misguided statements about cartography. To begin, the entire concept of a list of “things you must do to make a proper map” is deeply, fundamentally flawed. A list of requirements for how to make a good map is dangerous because it tempts beginners into shutting off their critical thinking and their creativity. Beyond the philosophical problems of actually having a list of required map elements, there are issues with the specific items on the list. Title: Most maps do probably need titles, but it really depends on the context. North Arrow: Most maps don’t need a north arrow. From the US Census Bureau, via Wikimedia Commons It has no north arrow. From Wikipedia
40 Maps They Didn’t Teach You In School By the time we graduate high school, we learn that they never taught us the most interesting things in there. Sure, you might be able to name the European countries or point New York on the map, but does that give a you real understanding of how the world functions? To fill this gap, we have gathered a great and informative selection of infographical maps that they should’ve shown us at school: every single one of these maps reveals different fun and interesting facts, which can actually help you draw some pretty interesting conclusions. Show Full Text What makes infographical maps so engaging is how easy it becomes to conceive graphically presented information. Without further ado, we invite you to learn things like most popular sports in different countries, who has the largest breasts, red hair map of Europe, world’s most consumed alcoholic beverages, or which brands dominate in different states of the USA. Trust us, these are way better than the ones they taught you at school!
"Knowing how you know" | Mr. Stevens TOK site