
Part 2: The essential collection of visualisation resources - Flock. This is the second part of a multi-part series designed to share with readers an inspiring collection of the most important, effective, useful and practical data visualisation resources.
The series will cover visualisation tools, resources for sourcing and handling data, online learning tutorials, visualisation blogs, visualisation books and academic papers. Your feedback is most welcome to help capture any additions or revisions so that this collection can live up to its claim as the essential list of resources. This second part presents the prominent and powerful data visualisation programming languages and environments that dominate the creative engineering that sits behind today’s design output.
Please note, I may not have personally used all the tools presented here but have seen sufficient evidence of their value from other sources. 25 Mind Blowing Social Media Infographics - Flock. Posted by Michael Duvall in Social Media on Jan 7th, 2010 | 93 responses Inforgraphics, “extensively [used] as tools by computer scientists, mathematicians, and statisticians” , have exploded onto the internet in the last few years. What’s so great about these aesthetic pieces of ‘data reinforced gems’, is their ability to paint a larger picture of what it is the creator is trying to express.
With the complexity and explosive growth of social media over the last few years, it’s not hard to see why so many have looked to express this information in a visually appealing manner – not to mention the benefits they provide when putting on a group presentation. The following 25 social media infographics have been reduced in size to allow you to quickly scroll down the page. Each one has been linked to the original and it is highly encouraged that you visit the links to see them in their full size. 1. 2. 3. 4. 5. 6. 7. Infographic-How-Much-Power-Does-it-Take-to-Power-the-Internet.pn.
27+ Beautiful Examples of Infographics Learn how to earn $125 or more per hour as a freelancer - Click Here Looking for hosting?.
We recommend MediaTemple for web hosting. Use Code MTLOVESDESIGN for 20% off. Information Is Beautiful - Flock. Thanks to data gathering by Brian Solis.
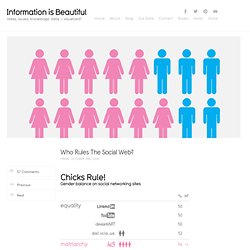
My data here. In passing, it’s interesting how Google Ad Planner gives detailed data on every big website online. But not on any of Google’s own sites.
Brazil. Living Maps. Visualize. S Person of the Year 1927 - 2009 - TIME - Flock. Labs / arc - Flock. Op-Chart - Picturing the Past 10 Years - Graphic - NYTimes.com - 5 Ways to Grow in Any Economy - Business Innovation Strategy - E. Learn to keep your company moving even when things are stagnant.

Even in tough economic times, small businesses need to find new ideas, develop original products, and engineer fresh market approaches. These are the pillars of good business, and each is made from a mixture of creativity and expertise. While it may seem counterintuitive, it's entirely possible to implement strategies that drive not only employee engagement, but also innovation and, ultimately, sales--all without enormous investment in systems or people. What can your company do to remain fresh, vibrant and alive--all without breaking the bank?
Here are five ways: 1. Often simply changing the physical working location to the café or tea house on the corner can produce a stream of new and valuable ideas. 2. Keep in mind, though, that while there are many benefits to virtualizing a company, the reduction in face time also necessitates a change in management style. 3. Welcome to the Now Network. - Flock. The History of Hacking - Flock. A Internet, seis décadas - A Internet - Discovery Channel - Floc. Internet Memes - Flock. Trololololololololololo man Feb 28, 2010 6:00 PM Added to Youtube in November of 2009 the Video "Я очень рад, ведь я, наконец, возвращаюсь домой" had only few views until it was posted into several music blogs in march of 2010.
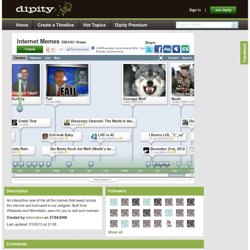
In a week more than 1 million people watched the Trololololololololololo man sing his song. The title translates into 'I am very glad, because I’m finally back home'. The Singer is called Eduard Anatolyevich Khil born in 1934 who performed this song at a TV-Show in 1976. Why won't my parakeet eat my diarrhea? Nov 11, 2009 9:00 AM "Why won't my parakeet eat my diarrhea? " George W Bush shoes attack in Bagdad Dec 14, 2008 An Iraqi journalist hurled his shoes at Mr. 30 Superb Examples of Infographic Maps.
As you search the web you’ll come across a wide range of interactive and graphical maps.
Deciding when, where and how to integrate or display a map on your site is the first step, the second should be what technology and illustrations to use. If you’re all about interaction, JQuery, Ajax, or Flash are all effective technologies that hold their own ground. Map illustrations are a dime a dozen however, a strong and balanced display of graphics, information, and colors is what makes an infographic stand out and reach its target audience effectively. As designers, we’re constantly searching for ways to improve and style our designs, this is exactly what the following 30 infographics and sites display below; the breaking of rules. Sites with Interactive Maps Illustrative Infographics Compiled exclusively for WDD by Liz Fulghum.
Magazine Covers - TIME Covers - TIME Magazine Cover Archive - Fl. The Beauty of Infographics and Data Visualization.