

Visual Storytelling: New Language for the Information Age. A Periodic Table of Visualization Methods. 14 Ways to Present Information Visually. The Best Tools for Visualization. Visualization is a technique to graphically represent sets of data.
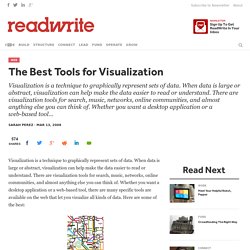
When data is large or abstract, visualization can help make the data easier to read or understand. There are visualization tools for search, music, networks, online communities, and almost anything else you can think of. Whether you want a desktop application or a web-based tool, there are many specific tools are available on the web that let you visualize all kinds of data. Here are some of the best: Visualize Social Networks. Very Visual Vocabulary. If you are like me or like my students, learning vocabulary can be tedious and boring.
Have I said that before? Boring. A New Way To Teach Using Wordle. Pictures convey meaning in profound ways. I’ll illustrate this using a free word cloud program called www.wordle.net . Below I have a series of favorite quotes on visualization, with references. Attached I have a word cloud of the quotes (minus the source). Kuinka tehdä visuaalisia muistiinpanoja iPadillä? How to create a sketchnote video. Sketchnotesit, visuaaliset muistiinpanot ja piirretyt videot. Linda Saukko-Rauta - CV. Linda Saukko-Rauta SlideShare. Ja kokouksia, kehittämispäiviä, konferensseja, työpajoja, koulutuksia, valmennuksia ja ja ja… Saukon Taivaspaikka « Ihmettelee ja piirtää.
A new home for my sketchnotes! How to make RSA Animate style videos with your class… How To Create Your Own Venn Diagrams. How To Capture Ideas Visually With The iPad. By its very design, the iPad promotes consumption.
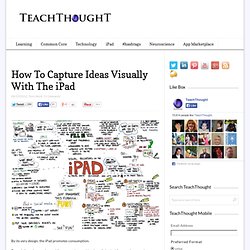
Essentially an interactive mobile screen, the combination of physical form and supporting software-based user interface on Apple’s wunder-tablet suggests watching and listening, enabling you to tear the “monitor” off the desk and take it with you. By lacking a keyboard, input and production aren’t quite as natural. How Technology Can Be Used To Better Understand Text. The advent of computers and their incredible processing power has meant little to improved comprehension of prose-based text, especially in terms of syntax, semantics, tone, structure, and so on.
It certainly has improved the way those texts can be delivered, liked, curated, shared, and displayed, but improved understanding has been mostly limited to the human brain and its ability to form wisdom and expertise. Recently, however, this trend has shifted as powerful visualization tools have emerged. My 10 Favorite Educational Mind Maps. 7 Online Quiz Tools Perfect For Classrooms 19.93K Views 0 Likes. Mind Map Library. 1000s of Mind Maps in FreeMind, MindManager and other formats - Mappio. 4 Ways To Enhance Your Teaching With Mind Mapping. The more efficient your teaching technique the better your students’ comprehension level. This is just one of the benefits of mind mapping and encouraging students to work together as they learn new things.
The following techniques, can be easily integrated in your teaching activity: Tiedon kuvia: Mihin mind mapissa tarvitaan kuvia? Teaching Writing and Learning With Graphic Organizers. For some reason, writing tends to be the task many students dread the most.

As a result, teachers are always on the lookout for ways to make the assignment more enjoyable – or at least less despised! Incorporating graphic organizers into the writing and learning process is a great way to get students to think outside the box and engage more willingly in the process. What Are Graphic Organizers? A graphic organizer is a visual aid that helps depict the correlation between ideas, facts, or concepts. The most common visual learning strategies are concept mapping, webbing, and mind mapping. Concept Mapping A concept map creates a visual representation of the relationship between ideas. Cartes heuristiques : quels outils pour un usage pédagogique ? Dans le cadre du GIPTIC documentation de Paris (Groupe d’Intégration Pédagogique des Technologies de l’Information et de la Communication), je propose une animation sur les cartes cognitives. C’est donc l’occasion de publier un article sur le sujet, ainsi que le support de formation.
Etudier à l’université : cartes mentales et conceptuelles. Comment mieux comprendre ?
Comment mieux retenir ? Comment voir les liens entre les cours ? Comment visualiser les relations entre les concepts ? Les outils issus de la pensée visuelle – carte mentales, conceptuelles, argumentaires – constituent une batterie intéressante pour l’étudiant à l’université. Voici quelques exemples issus de ma pratique de coach étudiant dans ce premier article de la série Etudier à l’université. Värit ovat ikivanha visuaalinen kieli. ‘Post It Note Pedagogy’ – Top Ten Tips for Teaching & Learning. The Ultimate Low Cost, High Impact Teaching Tool?
The humble post it note – sometimes you don’t need to invest in a fleet of iPads, interactive whiteboards or Visualisers to make the learning visible and to have a positive impact upon learning. Some of the best things in life are simple…and yes, cheap! The post it note is so flexible, easy to use and multi-purpose that it most surely must qualify for the ultimate low cost, high impact teaching tool. The Best 10 Tools to Create Posters for your Classroom. Today, we are sharing with you some great web tools that you can use to create your own posters and customize them the way you want.
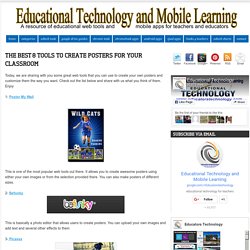
Check out the list below and share with us what you think of them. Enjoy 1- Poster My Wall This is one of the most popular web tools out there. Storybird - omia tarinoita kivoista kuvista. The 200 Best Graphic, App & Web Design Tools & Resources (Categorized) This post is #21 in DailyTekk’s famous Top 100 series which explores the best startups, gadgets, apps, websites and services in a given category.
Total items listed: 198. Time to compile: 8+ hours. Follow @DailyTekk on Twitter to make sure you don’t miss a week! The Best Graphic Novels and Graphic Nonfiction of 2012.