
D3 + Leaflet. This is a quick demonstration of using D3 to render GeoJSON shapes in conjunction with Leaflet.
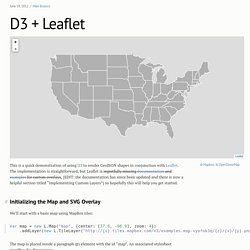
The implementation is straightforward, but Leaflet is regretfully missing documentation and examples for custom overlays, [EDIT: the documentation has since been updated and there is now a helpful section titled “Implementing Custom Layers”] so hopefully this will help you get started. #Initializing the Map and SVG Overlay We’ll start with a basic map using MapBox tiles: The map is placed inside a paragraph (p) element with the id “map”. An associated stylesheet specifies the dimensions: Next, we add an SVG element to Leaflet’s overlay pane. Leaflet/Leaflet.label. Mlevans/leaflet-hash. Turbo87/leaflet-sidebar.
Makinacorpus/django-leaflet. Yohanboniface/Leaflet.Storage. Ebrelsford/Leaflet.loading. Mapbox/leaflet-pip. D3 + Leaflet. Rclark/leaflet-d3-layer. Ebrelsford/Leaflet.snogylop. Ebrelsford/Leaflet.snogylop. jQuery Birdseye Demo - a plugin for moving map search. Makinacorpus/Leaflet.Social. Nnseva/Leaflet.Astar. Geopy/geopy. Math - How do I combine complex polygons? Algorithm - Union of many (more than two) polygons without holes. Math - How do I combine complex polygons? Algorithm - polygon union without holes. r360-js/r360-src.js at master · route360/r360-js. Route360° JavaScript API - Leaflet plugin for online network analysis. Leaflet/Leaflet.heat. Center Geolocations. How to get the center of a polygon in google maps v3? Quickhull (Javascript) Add a point to expand polygon without appending it in Google Maps?
Overlay - Removing group of markers Google maps API v3. Heatmaps - Google Maps JavaScript API v3. Ben.Knows.Code(): Using Google Maps Drawing Manager to Create User Selectable Areas. The Google Maps API has been on my list of things to learn for some time now.
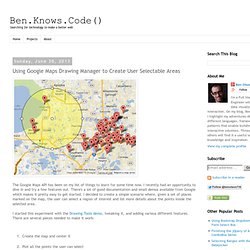
I recently had an opportunity to dive in and try a few features out. There's a lot of good documentation and small demos available from Google which makes it pretty easy to get started. I decided to create a simple scenario where, given a set of places marked on the map, the user can select a region of interest and list more details about the points inside the selected area. I started this experiment with the Drawing Tools demo, tweaking it, and adding various different features. There are several pieces needed to make it work: Create the map and center it Plot all the points the user can select Create the DrawingManager, tell it what to draw, and then listen for it to complete drawing that object Each time a selection is made, find the points inside the area and list them next to the map Maintain only one selection area.
API 2.0: Introduction. What are the pros and cons of each "Places" API? Kni-labs/rrssb. Sort latitude and longitude coordinates into clockwise ordered quadrilateral. Using PHP variable in javascript for Google Maps polygon. How can I convert a google maps circle into GeoJSON? Using Leaflet v0.7. The Leaflet JavaScript library has changed the way OpenStreetMap is being used, making it easy to use and offering all kinds of additional features and functions as plug-ins.
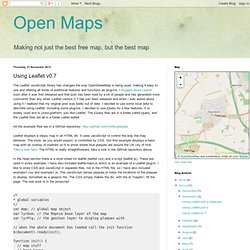
I blogged about Leaflet soon after it was first released and that post has been read by a lot of people and has generated more comments than any other. Leaflet version 0.7 has just been released and when I was asked about using it I realised that my original post was badly out of date. Computing Distances. Angularjs - Changing list-item css class using ng-class when mousing over Leaflet Map Markers. LEAFLET - store and retrieve user markers & diagrams from database. I am intending to use leaflet in order to build a "microscope laboratory" for my institute's medical school.
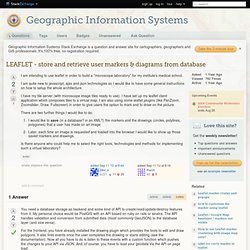
I am quite new to javascript, ajax and json technologies so I would like to have some general instructions on how to setup the whole architecture. I have my tile server (with microscope image tiles ready to use). I have set up my leaflet client application which composes tiles to a virtual map. I am also using some leaflet plugins (like PanZoom, Zoomslider, Draw, Fullscreen) in order to give users the option to mark and to draw on the picture. There are two further things I would like to do: Math Forum - Ask Dr. Math. Math - How do I calculate distance between two latitude-longitude points? Calculate distance between latitude longitude pairs with Python.
The Haversine formula is an equation that can be used to find great-circle distances between two points on a sphere from their longitudes and latitudes.
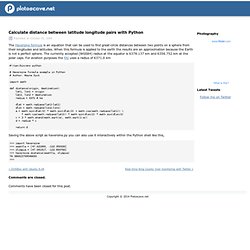
When this formula is applied to the earth the results are an approximation because the Earth is not a perfect sphere. The currently accepted (WGS84) radius at the equator is 6378.137 km and 6356.752 km at the polar caps. For aviation purposes the FAI uses a radius of 6371.0 km #! Calculate distance and bearing between two Latitude/Longitude points using haversine formula in JavaScript. Haversine_salvador. Heatmaps - Google Maps JavaScript API v3. Snapping - Leaflet snap circle draw to marker. Current community your communities Sign up or log in to customize your list. more stack exchange communities Stack Exchange.
Math Forum - Ask Dr. Math. Leaflet/GeoJSON.js at master · CloudMade/Leaflet. Computing Distances. Haversine_salvador. Calculate distance and bearing between two Latitude/Longitude points using haversine formula in JavaScript. Calculate distance between latitude longitude pairs with Python. Mapping rent, income and other data in every American neighborhood. jStorage - simple JavaScript plugin to store data locally. Create a Connector – import.io Help Center. A connector allows you to get structured data from a search result.
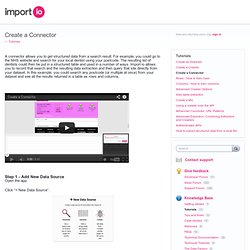
For example, you could go to the NHS website and search for your local dentist using your postcode. The resulting list of dentists could then be put in a structured table and used in a number of ways. Import·io allows you to record that search and the resulting data extraction and then query that site directly from your dataset.
In this example, you could search any postcode (or multiple at once) from your dataset and see all the results returned in a table as rows and columns. Step 1 - Add New Data Source Open the app. Click “+ New Data Source”. This will open a new tab and launch you into the workflow. Note: This is where the instructions will appear while you are in the workflow. Javascript - Unable to get Mapbox leaflet-omnivore to load markers from .csv. Here's the working snippet I've used, and everything works ok: omnivore.csv('teams.csv').addTo(map); However, you don't need to rush into changing the code, because, in your case, any change goes wrong as long as you load your file using the file protocol:
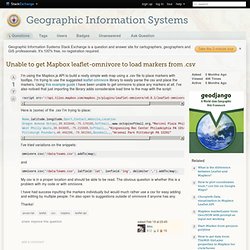
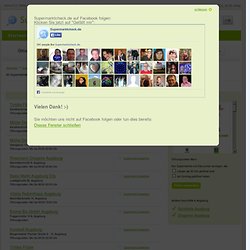
Leaflet - a JavaScript library for mobile-friendly maps. Loading markers from CSV. Supermärkte und Discounter in Augsburg. Supermarktcheck.de auf Facebook folgen:Klicken Sie jetzt auf "Gefällt mir":
Design and publish beautiful maps. Apartments for Rent - PadMapper Apartment Search for Oodle, Rent.com, Kijiji, and Craigslist Apartments. Elabel.js (4.9 KB) - gmaps-api-issues - Google Maps API bug reports and feature requests. Google Maps API Tutorial. Google Maps API Tutorial This tutorial is intended to help you create your own interactive maps using the Google API.
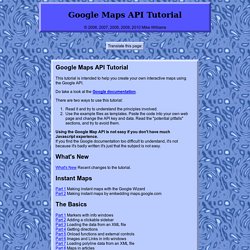
Do take a look at the Google documentation. There are two ways to use this tutorial: Read it and try to understand the principles involved. Use the example files as templates. Apartments for Rent - PadMapper Apartment Search for Oodle, Rent.com, Kijiji, and Craigslist Apartments. Five Best Apartment Search Tools. Apartments for Rent - PadMapper Apartment Search for Oodle, Rent.com, Kijiji, and Craigslist Apartments. Hack Attack: Apartment hunting 101. MyApartmentMap Apartment Rental Search. Map Based Listings of Apartments for Rent.
5844 sqft, $2,995,368, New York, NY 10011. Student Housing. Simplified. - Comfy. Walk Score Apartment Search. Kartenanwendungen programmieren mit Google Maps... - Seite 3. Reisekosten, Wanderung oder Fahrradtour: Heute organisiert der IT-kundige Anwender derlei mit Google Maps oder Open Streetmap.
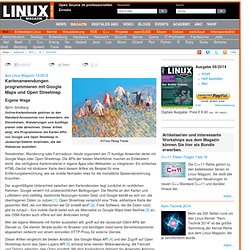
Die APIs der beiden Marktführer machen es Entwicklern leicht, das verfügbare Kartenmaterial in eigene Apps oder Webseiten zu integrieren. Rate Limits. Usage of the API is subject to rate limits. The limits are based on a moving window that tracks the number of requests you send per hour. An application can make up to 5,000 userless requests per hour to venues/* endpoints. An application can make up to 500 userless requests to most other endpoints groups per hour.
Geographischer Mittelpunkt. Orthodrome. Der kürzeste Weg auf der Kugeloberfläche zwischen Punkt A und B ist eine Orthodrome. Calculate distance between two points in google maps V3. Smallest-circle problem. The smallest-circle problem in the plane is an example of a facility location problem (the 1-center problem) in which the location of a new facility must be chosen to provide service to a number of customers, minimizing the farthest distance that any customer must travel to reach the new facility.[3] Both the smallest circle problem in the plane, and the smallest bounding sphere problem in any higher-dimensional space of bounded dimension, may be solved in linear time. Characterization[edit] Most of the geometric approaches for the problem look for points that lie on the boundary of the minimum circle and are based on the following simple facts: The minimum covering circle is unique.The minimum covering circle of a set S can be determined by at most three points in S which lie on the boundary of the circle.
If it is determined by only two points, then the line segment joining those two points must be a diameter of the minimum circle. Das 1-Center-Problem. Design and publish beautiful maps. TileMill. Documentation. API Reference This reference reflects Leaflet 0.7. Docs for 0.6 are available in the source form (see instructions for running docs). Gallery · mbostock/d3 Wiki. Wiki ▸ Gallery Welcome to the D3 gallery!
More examples are available for forking on Observable; see D3’s profile and the visualization collection. Please share your work on Observable, or tweet us a link! Visual Index Basic Charts Techniques, Interaction & Animation. ArcGIS Desktop. Haversine formula. The haversine formula is an equation important in navigation, giving great-circle distances between two points on a sphere from their longitudes and latitudes. It is a special case of a more general formula in spherical trigonometry, the law of haversines, relating the sides and angles of spherical triangles. The term haversine was coined in 1835 by Prof. James Inman. These names follow from the fact that they are customarily written in terms of the haversine function, given by haversin(θ) = sin2(θ/2). The formulas could equally be written in terms of any multiple of the haversine, such as the older versine function (twice the haversine). The next most obvious thing.