
TÌM HIỂU BAN ĐẦU VỀ WEB SERVICE. R/Finance 2016. Understanding PCA. No one can master every algorithm.

However, there is a basic toolbox that every Data Scientist understands and uses. One of the algorithms in this toolbox is Principal Component Analysis – P.C.A for short. It is an unsupervised learning technique used in many different fields to handle high dimensional data, like genomics and quantitative finance, to name two. P.C.A identifies patterns in data by noting correlations between features. It then eliminates structural redundancies through a process known as dimensionality reduction. These principal components are a set of linear combinations of the original features. \(PC_1 = \beta_{11}{X_1}+ \beta_{12}{X_2} + … + \beta_{1p}X_p\) Where \(\beta_{1} = \beta_{11} + \beta_{12} + … + \beta_{1p}\) is called the direction of \(PC_1\). Detecting seasonality. I occasionally get email asking how to detect whether seasonality is present in a data set.
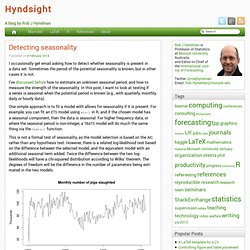
Sometimes the period of the potential seasonality is known, but in other cases it is not. I’ve discussed before how to estimate an unknown seasonal period, and how to measure the strength of the seasonality. In this post, I want to look at testing if a series is seasonal when the potential period is known (e.g., with quarterly, monthly, daily or hourly data). One simple approach is to fit a model with allows for seasonality if it is present. For example, you can fit an ETS model using ets() in R, and if the chosen model has a seasonal component, then the data is seasonal. What’s Next for Artificial Intelligence. How to Select Support Vector Machine Kernels. Support Vector Machine kernel selection can be tricky, and is dataset dependent.

Here is some advice on how to proceed in the kernel selection process. Given an arbitrary dataset, you typically don't know which kernel may work best. I recommend starting with the simplest hypothesis space first -- given that you don't know much about your data -- and work your way up towards the more complex hypothesis spaces. So, the linear kernel works fine if your dataset if linearly separable; however, if your dataset isn't linearly separable, a linear kernel isn't going to cut it (almost in a literal sense ;)). For simplicity (and visualization purposes), let's assume our dataset consists of 2 dimensions only. This works perfectly fine. Now, it looks like both linear and RBF kernel SVM would work equally well on this dataset. Okay, what I've said above sounds all very negative regarding kernel methods, but it really depends on the dataset. In this case, a RBF kernel would make so much more sense:
BAyes for Vietnam. Đây là dự án viết sách hướng dẫn phân tích số liệu sử dụng phần mềm R theo trường phái Bayes.

Trường phái Bayes đã thể hiện nhiều điểm vượt trội hơn so với phương pháp truyền thống (trường phái frequentist) trong việc diễn giải và phân tích số liệu. Tuy nhiên việc ứng dụng rộng rãi Bayes vẫn còn gặp nhiều khó khăn, chủ yếu là do khó khăn trong thuật toán để đạt được phân phối hậu nghiệm. Với sự phát triển vũ bão của năng lực máy tính, các phần mềm như JAGS hay STAN có thể giúp chúng ta mô phỏng phân phối hậu nghiệm một cách nhanh chóng. Tuy nhiên việc xây dựng mô hình trong JAGS hay STAN để đạt được phân phối hậu nghiệm tương đối phức tạp đối với những nhà nghiên cứu ứng dụng không chuyên về thống kê. Chính vì vậy, mục đích chính của cuốn sách này là muốn giới thiệu với bạn đọc cách phân tích số liệu sử dụng phần mềm R theo trường phái Bayes một cách đơn giản, dễ hiểu, dễ làm.
MLDB Documentation. Current Issue. The evolving IT landscape. Facebook Code.
Courses. Statistics.