
Software: Classification: SVM (Support Vector Machines) Sentiment Classification using Machine Learning Techniques. Sentiment Analysis. The sentiment score is indexed on a normalized minus five (-5) to plus five (+5) scale.
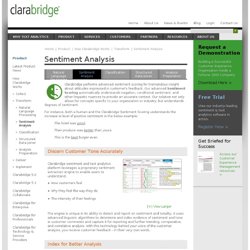
With this index, business users can roll up scores to preset categories, regions, or products, etc. to see sentiment trends across a brand, product, and/or company level. Tune for Precision. The process of indexing the relative negativity (or positivity) is scored at a word, phrase, and linguistic construct level. This enables the system to identify complex linguistic constructs like negation, capitalization of words and other visual indicators of tone. Our sentiment analysis interface enables your analysts to further refine our out-of-the-box models to: Modify a word's sentiment rating. Handle negation. Use exception rules to specify context. SentimentAnalysisAPI.jpg (Image JPEG, 1008x725 pixels)
SentimentAnalysisAPI.jpg (Image JPEG, 1008x725 pixels) Book - Natural Language Toolkit. Exploring Elasticsearch - Tutorial and Book. Data journalism: 22 key links « Simon Rogers. Simon Rogers Data journalism and other curiosities Search Subscribe to RSS.

Ideas, issues, knowledge, data - visualized! Visualize your Twitter network « Verkostoanatomia – the Network Approach. Statistics: Making Sense of Data. About the Course We live in a world where data are increasingly available, in ever larger quantities, and are increasingly expected to form the basis for decisions by governments, businesses, and other organizations, as well as by individuals in their daily lives.
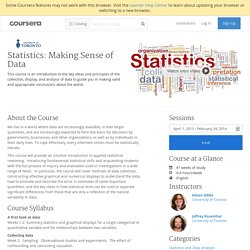
To cope effectively, every informed citizen must be statistically literate. This course will provide an intuitive introduction to applied statistical reasoning, introducing fundamental statistical skills and acquainting students with the full process of inquiry and evaluation used in investigations in a wide range of fields. In particular, the course will cover methods of data collection, constructing effective graphical and numerical displays to understand the data, how to estimate and describe the error in estimates of some important quantities, and the key ideas in how statistical tests can be used to separate significant differences from those that are only a reflection of the natural variability in data.
Getting Started With The Gephi Network Visualisation App – My Facebook Network, Part I. A couple of weeks ago, I came across Gephi, a desktop application for visualising networks.
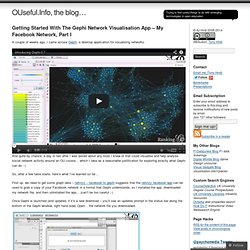
And quite by chance, a day or two after I was asked about any tools I knew of that could visualise and help analyse social network activity around an OU course… which I take as a reasonable justification for exploring exactly what Gephi can do :-) So, after a few false starts, here’s what I’ve learned so far… Guides/data-bulletproofing.md at master · propublica/guides.
Interactive News Graphics Collection. Analytics. 3 – Le data mining et le marketing ciblé. Undercover marketing sur Internet : Le recrutement d’ambassadeurs ou d’agents. Le développement d’Internet a provoqué la multiplication des pratiques d’utilisation à grande échelle d’ambassadeurs ou d’agents de marques.

Le terme d’agent est plus adapté pour les véritables actions d’undercover marketing, car contrairement à un ambassadeur, un agent ne révèle pas la nature de sa mission et le fait qu’il agit sur demande d’une agence ou d’un annonceur, et qu’il est plus ou moins rémunéré ou récompensé pour ses actions de prosélytisme envers la marque.
Stratégie cross canal. Click and Collect. Etude. De la mesure de l'effet ROPO via les coupons. Business intelligence. ROI= communities analysis. A framework for social analytics by Altimeter Group. Clustered Networks Spread Behavior Change Faster. Unlike infectious diseases and news, behavior change spreads faster through online networks that have many close connections instead of many distant ties.
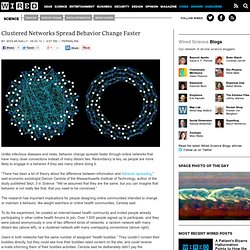
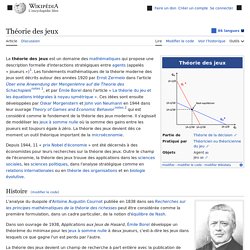
Redundancy is key, as people are more likely to engage in a behavior if they see many others doing it. “There has been a lot of theory about the difference between information and behavior spreading,” said economic sociologist Damon Centola of the Massachusetts Institute of Technology, author of the study published Sept. 3 in Science. Analyse prédictive. Oxford Digital Data Dialogue. Big Data, la prochaine révolution informatique. Big Data : la quatrième révolution industrielle ? « Big Data » : le champ du possible tiré par l’évolution des technologies.
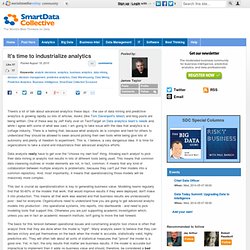
Allez donc sur google trends pour vérifier la fréquence de recherche sur « Big Data » : le terme apparaît réellement dans les radars mi 2010 pour résonner toujours plus fort. Et si, San Francisco et Bangalore restent surreprésentés, une part significative des recherches provient maintenant de villes en dehors de ces deux Silicon Valleys, signes que le concept sort du cercle fermé des geeks. Théorie des jeux. La théorie des jeux est un domaine des mathématiques qui s'intéresse aux interactions stratégiques des agents (appelés « joueurs »).
Les fondements mathématiques de la théorie moderne des jeux sont décrits autour des années 1920 par Ernst Zermelo dans l'article Über eine Anwendung der Mengenlehre auf die Theorie des Schachspiels, et par Émile Borel dans l'article « La théorie du jeu et les équations intégrales à noyau symétrique ». Ces idées sont ensuite développées par Oskar Morgenstern et John von Neumann en 1944 dans leur ouvrage Theory of Games and Economic Behavior qui est considéré comme le fondement de la théorie des jeux moderne. Kelly. Théorie des jeux. Its-time-industrialize-analytics from smartdatacollective.com - StumbleUpon. There's a lot of talk about advanced analytics these days - the use of data mining and predictive analytics is growing rapidly so lots of articles, books (like Tom Davenport's latest) and blog posts are being written.
One of these was by Jeff Kelly over on TechTarget on Data analytics team’s needs and, while I agree with some of what was said, I am going to take issue with the idea that analytics is a cottage industry. There is a feeling that, because what analysts do is complex and hard for others to understand they should be allowed to swan around picking their own tools while being give lots of autonomy and plenty of freedom to experiment.
This is, I believe, a very dangerous idea. It is time for organizations to take a stand and industrialize their advanced analytics efforts. Data analysts really have to get over the "choose my own tool" thing. This last is crucial as operationalization is key to generating business value. Some other quick thoughts in this vein: Its-time-industrialize-analytics from smartdatacollective.com - StumbleUpon. Social Media's Critical Path: Relevance to Resonance to Significance - Brian Solis - The Conversation. How Target Figured Out A Teen Girl Was Pregnant Before Her Father Did. Graph (mathematics) The edges may be directed or undirected.
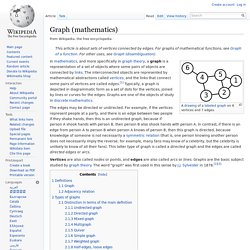
For example, if the vertices represent people at a party, and there is an edge between two people if they shake hands, then this is an undirected graph, because if person A shook hands with person B, then person B also shook hands with person A. In contrast, if there is an edge from person A to person B when person A knows of person B, then this graph is directed, because knowledge of someone is not necessarily a symmetric relation (that is, one person knowing another person does not necessarily imply the reverse; for example, many fans may know of a celebrity, but the celebrity is unlikely to know of all their fans). This latter type of graph is called a directed graph and the edges are called directed edges or arcs. Vertices are also called nodes or points, and edges are also called arcs or lines.
Graphs are the basic subject studied by graph theory. Definitions in graph theory vary. (the number of vertices). Bayes.wustl.edu/etj/prob/book.pdf. Community management. E-Reputation. Social Media Analytics.