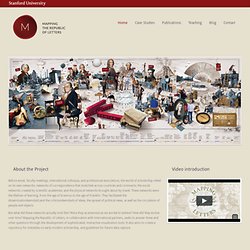

David McCandless: The beauty of data visualization. Socjologia cyfrowa. Mapping the Republic of Letters. About the Project Before email, faculty meetings, international colloquia, and professional associations, the world of scholarship relied on its own networks: networks of correspondence that stretched across countries and continents; the social networks created by scientific academies; and the physical networks brought about by travel.

These networks were the lifelines of learning, from the age of Erasmus to the age of Franklin. They facilitated the dissemination&emdash;and the criticism&emdash;of ideas, the spread of political news, as well as the circulation of people and objects. But what did these networks actually look like? Izing Empires' Decline. Britain's Royal Navy in the First World War - animated. Software Studies. Gallery @ Calit2 - Mapping Time. Cultural Analytics - Mark Rothko Paintings - on the 287-Megapixel HIPerSpace Wall at Calit2.
Style Space: How to compare image sets and follow their evolution. Draft text by Lev Manovich (August 4-6, 2011).

All projects and visualizations are created by members of Software Studies Initiative (credits appear under the images on Flickr) Batch image processing softwate: Sunsern Cheamanunkul and Jeremy Douglass. ImagePlot visualization software: Lev Manovich, Jeremy Douglass, Nadia Xiangfei Zeng. ImagePlot documentation: Tara Zepel.
Journalism in the Age of Data, Ch. 1: Introduction. Projekty. Digital storytelling. Google Demo Slam: Epic Docs Animation. Visualize This. The Value of Data Visualization. A Brief History of Digital Data. YouTube - One Hour Per Second. Zooniverse - Real Science Online. Broadcast Yourself.