
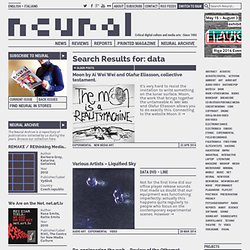
What is Missing? Data Visualization. »Digital Grotesque is the first fully immersive, solid, human-scale, enclosed structure that is entirely 3D printed out of sand.
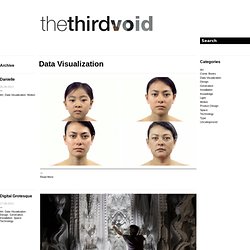
This structure, measuring 16 square meters, is materialized with details at the threshold of human perception. Every aspect of this architecture is composed by custom-designed algorithms.« Read More The final thesis by visual artist Daniel Sierra is soothing, intriguing and blows my particles. Read More A clever infographicesque visualization of New York City’s CO2 emissions in 2012.
Art in the age of “big data” Lise Autogena + Joshua Portway, Most Blue Skies (2010) I’m currently at ISEA2012, the 18th International Symposium on Electronic Art, a six-day international conference, this year taking place in Albuquerque under the glorious banner ‘Machine Wilderness’, which references the New Mexico region as an area of rapid growth and technology within vast expanses of open land.
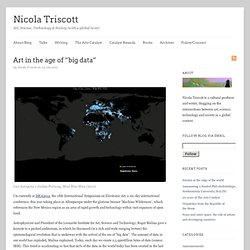
Astrophysicist and President of the Leonardo Institute for Art, Science and Technology, Roger Malina gave a keynote to a packed auditorium, in which he discussed (in a rich and wide-ranging lecture) the epistemological revolution that is underway with the arrival of the era of “big data”. The amount of data in our world has exploded, Malina explained. Pitch Interactive: The Holy Bible and the Holy Quran: A Comparison of Words. In order to understand a religion, we can refer to its holy book, which establishes guidelines and principles for followers to adhere to.
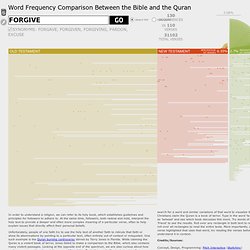
At the same time, followers, both radical and mild, interpret the holy text to provide a deeper and often more complex meaning of a particular verse, often to help explain issues that directly affect their personal beliefs. Unfortunately, people of one faith try to use the holy text of another faith to ridicule that faith or show its abominations by pointing to a particular text, often entirely out of context or misquoted. One such example is the Quran burning controversy stirred by Terry Jones in Florida. While claiming the Quran is a violent book of terror, Jones failed to make a comparison to the Bible, which also contains many violent passages. Looking at the opposite end of the spectrum, we are also curious about how each passage mentions love, tolerance and friendship. Point Cloud on Vimeo. Beall Center for Art + Technology. DataViz: Information as Art explores a wide range of practices that data artists and designers are currently using in their works including interactive dynamic images, sculptures and installations.
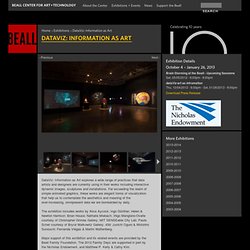
Far exceeding the realm of simple animated graphics, these works are elegant forms of visualization that help us to contemplate the aesthetics and meaning of the ever-increasing, omnipresent data we are bombarded by daily. The exhibition includes works by Alice Aycock; Ingo Günther; Helen & Newton Harrison; Brian House; Nathalie Miebach; Iñigo Manglano-Ovalle courtesy of Christopher Grimes Gallery; MIT SENSEable City Lab; Paula Scher courtesy of Bryce Walkowitz Gallery; 43d: Junichi Oguro & Motohiro Sunouchi; Fernanda Viégas & Martin Wattenberg. Major support of this exhibition and its related events are provided by the Beall Family Foundation. The 2012 Family Days are supported in part by the Nicholas Endowment, and Matthew P.
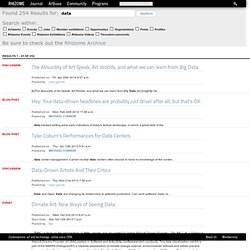
Kelly & Cathy Kim. The Creators Project. 33 examples of Data art and data installation. Mark Hansen and Ben Rubin: Listening Post, Real-Time Data Responsive Environment 2001. CreativeApplications.Net. Digicult magazine. Neural magazine. It’s very hard to resist the invitation to write something on the lunar surface.
Moon, the work that brings together the untameable Ai Wei Wei and Olafur Eliasson allows you to do exactly this. Rhizome. Published on Wed, Oct 2nd 2013 6:41 p.m.
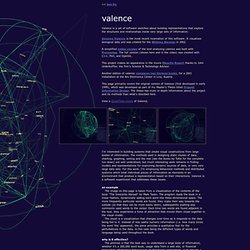
Start Date Sat, Oct 12th 2013 7 p.m. Plutchik Pulse Le Sanctum. Pulse on Vimeo. Freelance Creative Developer : IOS -OpenGL/WebGL – Flash – openFrameworks. Valence. << ben fry valence Valence is a set of software sketches about building representations that explore the structures and relationships inside very large sets of information.
'Welcome to the Anthropocene' Earth Animation. Archée : cyberart et cyberculture artistique. Entrevue avec ®TMark Richard Barbeau Dans le cadre de la participation du collectif d'activistes ®TMark à la Biennale du Whitney 2000, Archée (qui avait commenté l'événement le mois dernier) a réalisé une entrevue avec Ernest Lucha, porte-parole du groupe composé de cinq membres anonymes.
Rappelons que ®TMark fait partie de la sélection du volet Internet qui s'ajoute cette année à l'événement. Data.path, 26 SEP 2013 – 5 JAN 2014, Espacio Fundación Telefónica, Madrid, ES on Vimeo. Ryoji Ikeda : : test pattern [nº5], 8 JUN - 1 JUL 2013, Carriageworks, Sydney, AU on Vimeo. Albums de Eric Fischer sur Flickr. We Feel Fine / by Jonathan Harris and Sep Kamvar. Data.anatomy [civic], 19 APR - 1 MAY 2012, Kraftwerk, Berlin, DE on Vimeo. Bestiario. What Happens When Big Data and Art Meet. OECD – Your Better Life Index. Average personal index for Germany, men, 15–24 How’s life?

There is more to life than the cold numbers of GDP and economic statistics – This Index allows you to compare well-being across countries, based on 11 topics the OECD has identified as essential, in the areas of material living conditions and quality of life. Download executive summary Download the index data Learn more about the index. Max Planck Research Networks. This Is Maral - Portfolio. Ressources - Data Viz et Data Art / Usages des TIC, arts numériques et culture multimédia - Public Digital Art. DHC/ART: Ryoji Ikeda (English) on Vimeo.
Body. By Stanza. Data Art. About Stanza Stanza is an internationally recognized artist, who has been exhibiting worldwide since 1984.
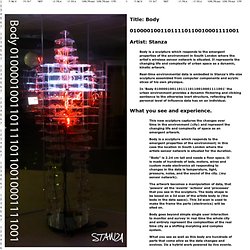
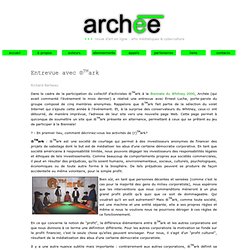
His artworks have won prestigious painting prizes and ten first prize art awards including:- Vidalife 6.0 First Prize. SeNef Grand Prix. Videobrasil First Prize. Stanzas art has also been rewarded with a prestigious Nesta Dreamtime Award, an Arts Humanities Creative Fellowship and a Clarks bursary award. Nathalie Miebach: Art made of storms. The Listening Machine. Markus Kison Pulse 2008. Pulse est une visualisation en temps réel des récentes émotions des rédacteurs de blogs privés du service Blogger. Celles-ci sont analysées et comparées à une liste de synonymes d’émotions.
Ces données sont visualisées physiquement par la métamorphose d’un objet malléable suspendu dans le vide par de nombreux fils reliés à des moteurs. Le tout est inspiré de la Théorie psychoevolutionaire des émotions de Robert Plutchik (1980) qui divise les émotions humaines en 8 émotions de bases reparties sur un cône tri-dimensionnel lui même divisé en 24 zones. Pulse peut grandir dans ces 24 directions et représente par ce volume une partie de l’état émotionnel actuel de l’Internet. L’oeuvre prend place dans un cube transparent de 50 cm de largeur. Markus Kison a étudié le design graphique et la physique à Ulm puis la communication visuelle à Berlin. Découvrez ses derniers travaux sur markuskison.de. Palimpseste 3D Navigator. Palimpseste 3D Navigator propose pour sa première utilisation une navigation dans le site internet Electronic Shadow. Un choix redactionnel a été concerté pour classer l'information du site en différentes catégories: les projets, les différents domaines de création, les thèmes, la chronologie ainsi que les lieux.
Palimpseste est un navigateur qui repose sur les liens. Chaque entité liée, ici des mots-clés, se définit à la fois par ce qu'elle est mais aussi par ce qui la relie aux autres entités. Chaque mot, en plus de ce qu'il représente, appartient donc à différents groupes de relations définis par des types de liens. @ Ars Electronica: The Big Picture.