
Blog. Perhaps it's subtle, but the draft spec for XMLHttpRequest calls for support for progressive response handling: 4.7.6 The responseText attribute The responseText attribute must return the result of running these steps: 1.

If the state is not LOADING or DONE return the empty string and terminate these steps. 2. To rephrase for my purposes, responseText should return the intermediate contents of the response when an XMLHttpRequest is interrogated during the LOADING state. I ran a modified version of the streaming response tests I used in my last post to verify progressive XHR handling. For Webkit browsers, it's critical to specify a Content-Type of "text/plain" or "application/x-javascript" when returning script content to an XHR for progressive handling.
Now, since we'll be interpreting partial response content as executable script, we'll need to do something to ensure that each chunk we evaluate terminates on a complete expression. 1.3.3 demo - jQuery. Window 1 I am plumbed with a Bezier connector to Window 2 and a label, with Blank endpoints.
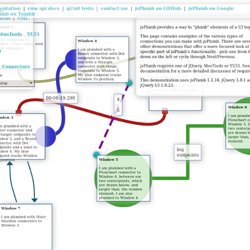
Window 2 I am plumbed with a Bezier connector to Window 1, and a Bezier connector with Rectangle endpoints to Window 3 Window 3 I am plumbed with a Bezier connector and Rectangle endpoints to Window 2, and a Bezier connector with Dot endpoints and a label to Window 4. Window 4 I am plumbed with a Bezier connector with Dot endpoints to Window 3, and with a Straight connector with Image endpoints to Window 5. Window 5 I am plumbed with a Flowchart connector to Window 6, between our two centerpoints, which are drawn below, and larger than, the window element; I am also plumbed to Window 4.
Window 6 I am plumbed with a Flowchart connector to Window 5, between our two centerpoints, which are drawn below, and larger than, the window element. Force-Directed Graph. This simple force-directed graph shows character co-occurence in . A physical simulation of charged particles and springs places related characters in closer proximity, while unrelated characters are farther apart. Layout algorithm inspired by Tim Dwyer and Thomas Jakobsen . Data based on character coappearence in Victor Hugo’s , compiled by Donald Knuth .
Source Code. 20 Fresh JavaScript Data Visualization Libraries. There are plenty of JavaScript libraries out there for rendering your otherwise plain and boring numerical data into beautiful, interactive, and informative visualizations.

The beauty of using JavaScript for data visualization is that, if created correctly, your data will be highly accessible (usually via HTML tables). A long time ago (2008), I wrote about JavaScript solutions for graphing and charting data and this article revisits the topic with twenty more JavaScript libraries that you can use to bring your data to life. 1. Highcharts Highcharts is one of the most promising JavaScript charting libraries to hit the scene recently, with its large array of features including seven charting types (line, pie, and bar among them), the ability to zoom in and out of charts, and tooltips for offering more information about data points. 2. gRaphaël gRaphaël is a charting library based on Raphaël, a vector graphics drawing JavaScript library. 16 Javascript Libraries for Visualizations on Datavisualization. DIY Data: Teaching Twitter API and DataViz @Betaworks. Last night I had the honor to lead the first BetaLabs class.

BetaLabs is an effort organized by product designer extraordinaire Summer Bedard, an internal Betaworks skill-sharing class that takes place every two weeks. I wanted to give a class that’ll utilize python to access the Twitter API, grab some interesting data, and visualize it. The necessary code was provided, and participants got a list of downloads and installs that needed to happen before the class. Within two hours, everyone was playing with a graph based on data that they grabbed from the Twitter API! The Class We used the tweepy python library to access the Twitter API. Lastly we exported this graph into .graphml format which we then imported into the open source network visualization software – gephi.
While the Betaworks network is pretty densely clustered (as expected – many Betaworkers follow other Betaworkers), different parameters reveal some interesting insight. The Outcome Photos and people’s graphs can be seen here. Mentionmapp. Hypertree - Tree Animation.