
Topic 6: Measurement and Evaluation - IB. Physical Educ8or: IB SEHS: Topic 6: Statistical Analysis. Standard Deviation - Explained and Visualized. How to Calculate Standard Deviation. Standard Deviation of a List - Casio Calculator - Leaving Cert Project Maths - Statistics. Standard Deviation and Standard Error of the Mean. Calculating Mean, Standard Deviation & Error In Excel.
Excel: Graphing with separate Error Bars of Standard Deviation. Coefficient of Variation Example and Explanation. Choosing a statistical test (Handbook of Biological Statistics) Choosing a Statistical Test. T-Test Definition. Student's t-test. Paired vs Unpaired T-Test: Differences, Assumptions and Hypotheses. Understanding t-Tests: 1-sample, 2-sample, and Paired t-Tests. In statistics, t-tests are a type of hypothesis test that allows you to compare means.

They are called t-tests because each t-test boils your sample data down to one number, the t-value. If you understand how t-tests calculate t-values, you’re well on your way to understanding how these tests work. In this series of posts, I'm focusing on concepts rather than equations to show how t-tests work. However, this post includes two simple equations that I’ll work through using the analogy of a signal-to-noise ratio. Should you use a one-tailed test or a two-tailed test for your data analysis? - Statistics Solutions.
When creating your data analysis plan or working on your results, you may have to decide if your statistical test should be a one-tailed test or a two-tailed test (also known as “directional” and “non-directional” tests respectively).
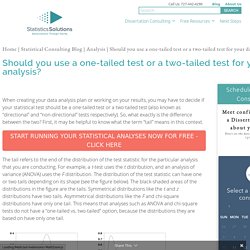
So, what exactly is the difference between the two? First, it may be helpful to know what the term “tail” means in this context. The tail refers to the end of the distribution of the test statistic for the particular analysis that you are conducting. For example, a t-test uses the t distribution, and an analysis of variance (ANOVA) uses the F distribution.
The distribution of the test statistic can have one or two tails depending on its shape (see the figure below). Carrying out a T-Test in Microsoft Excel. T-test in Microsoft Excel. QuickCalcs: t test calculator. A t test compares the means of two groups.

For example, compare whether systolic blood pressure differs between a control and treated group, between men and women, or any other two groups. Don't confuse t tests with correlation and regression. The t test compares one variable (perhaps blood pressure) between two groups. Use correlation and regression to see how two variables (perhaps blood pressure and heart rate) vary together. Quick P-Value Calculators. 1.1.6 Explain that a correlation does not establish that there is a causal relationship. How To Perform A Pearson Correlation Test In Excel. Correlation & R-squared. Chi Square Statistic (χ2) Definition. What Is a Chi Square Statistic?
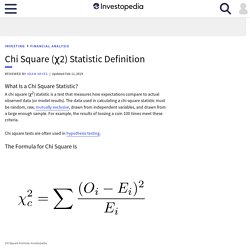
A chi square (χ2) statistic is a test that measures how expectations compare to actual observed data (or model results). The data used in calculating a chi square statistic must be random, raw, mutually exclusive, drawn from independent variables, and drawn from a large enough sample. For example, the results of tossing a coin 100 times meet these criteria. The Formula for Chi Square Is The subscript “c” are the degrees of freedom.O is the observed value(s).E is the expected value(s). What Does a Chi Square Statistic Tell You? There are two main kinds of chi square tests: the test of independence, which asks a question of relationship, such as, "Is there a relationship between gender and SAT scores? " For these tests, degrees of freedom are utilized to determine if a certain null hypothesis can be rejected based on the total number of variables and samples within the experiment.
In another example, consider tossing a coin 100 times. Key Takeaways. Using Chi-Square Statistic in Research - Statistics Solutions. The Chi Square statistic is commonly used for testing relationships between categorical variables. The null hypothesis of the Chi-Square test is that no relationship exists on the categorical variables in the population; they are independent. Chi-Square Test. Groups and Numbers You research two groups and put them in categories single, married or divorced: The numbers are definitely different, but ... Is that just random chance? Or have you found something interesting? Social Science Statistics. IB SEHS Tutorial Videos. Marginal gains: the rise of data analytics in sport. Look up to the stands at any professional sports match this weekend, and you’ll see people who seem to spend the entire game hidden behind an iPad.

Some will be fans taking selfies - a practice some clubs are now looking to ban - but others will be sports analysts. These scientists play an increasingly important role in professional sport. They monitor player performance, from the pitch to the court to the track. They assess tactics, examine the opposition and provide feedback for training. Sports analysts are involved in player recruitment, nutrition, and rehabilitation from injury, and they use video and data - captured or displayed on those iPads - to give real-time feedback to coaches during games. Sports analysts are also uncovering new facts about elite sport. As well as providing fans with useful statistics for after game banter, these data are also helping teams to improve player performance and fitness. Measurement is not limited to the field of play, however.