
jQuery Sparklines. News 15 June 2013 - Version 2.1.2 Relased This release adds support for jQuery 1.10.0 and other bug fixes and minor improvements.
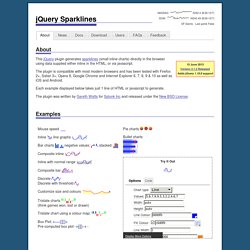
See the full changelog for details of all changes. Live demo: jQuery sparklines. Multiple Pie Charts in a WSS Dashboard. Note from EndUserSharePoint.com: We have updated the script below and apologize for the previous error.

From the feedback I received on my previous posts, I worked to develop a new jQuery script to present charts on SharePoint. It can be considered a major evolution of my first rudimentary pie charts versions because: - It uses pure JavaScript libraries, no need to send data to the Google Charts API (i.e. internet). - Charts are nicely arranged within an HTML table, with configurable columns. - When you click on a chart, you jump to a target page showing the underlying list view. - Represented data can be taken from different SharePoint lists. - At least in theory, an unlimited number of charts can be accommodated on a page.
Here is how the result looks like: I achieved that with the help of the free jsCharts library, and the invaluable code of Paul Grenier, in particular on this EUSP article.