
I - RapidAnalytics. Ideas, issues, knowledge, data - visualized! Getting-started:what-is-r:what-is-r. Clustergram: A graph for visualizing cluster analyses (R code) 150+ R Abbreviations. The R programming language includes many abbreviations.

Abbreviations exist in function names, argument names, and allowed values for arguments. This post expands on over 150 R abbreviations with the aim of making it easier for users new to R who are trying to memorise R commands. Context Abbreviations save time when typing and can make for less cumbersome code. However, abbreviations often make it more difficult to remember a command. Start [R-Node] Writing /var/www/r-node/data/cache/2/2d54f1d82cf67432cd4c82a000527112.i failed Unable to save cache file.
Hint: disk full; file permissions; safe_mode setting. Writing /var/www/r-node/data/cache/2/2d54f1d82cf67432cd4c82a000527112.xhtml failed R-Node is a web front-end to the statistical analysis package R . Using this front-end, you can from any web browser connect to an R instance running on a remote (or local) server, and interact with it, similar to how you interact with R through the R console. The R-Node server supports most standard commands, and should work with any package that provides textual output, or output via the standard graphing mechanisms. Graphs are created for the most part on the server, and are presented to the user over the network, where they can be saved by downloading.
You can view the slides for a talk I did to the Palmerston North Linux Users Group if you are interested. R-Node. Yeroon.net/ggplot2. Introduction yeroon.net/ggplot2 is a web interface for Hadley Wickham's R package ggplot2.
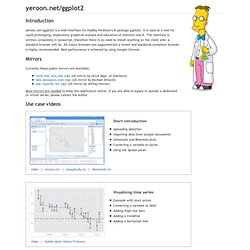
It is used as a tool for rapid prototyping, exploratory graphical analysis and education of statistics and R. The interface is written completely in javascript, therefore there is no need to install anything on the client side: a standard browser will do. A Practical Guide to Geostatistical Mapping. R-statistics blog. Ggplot. had.co.nz. Statistics. Stunning Infographics and Data Visualization. Feb 02 2010 Information graphics, or infographics, are visual representations of information, data or knowledge.
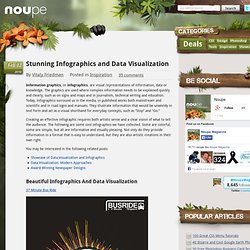
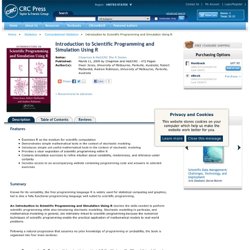
The graphics are used where complex information needs to be explained quickly and clearly, such as on signs and maps and in journalism, technical writing and education. Today, infographics surround us in the media, in published works both mainstream and scientific and in road signs and manuals. They illustrate information that would be unwieldy in text form and act as a visual shorthand for everyday concepts, such as “Stop” and “Go.” Creating an effective infographic requires both artistic sense and a clear vision of what to tell the audience. You may be interested in the following related posts: Incanter: Statistical Computing and Graphics Environment for Clojure. CRC Press Online - Book: Introduction to Scientific Programming and Simulation Using R. Features Examines R as the medium for scientific computation Demonstrates simple mathematical tools in the context of stochastic modeling Introduces simple yet useful mathematical tools in the context of stochastic modeling.
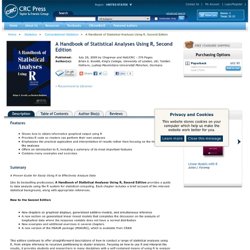
CRC Press Online - Book: A Handbook of Statistical Analyses Using R, Second Edition. Features Shows how to obtain informative graphical output using R Provides R code so readers can perform their own analyses Emphasizes the practical application and interpretation of results rather than focusing on the theory behind the analyses.
Talks. A Data Analysis Framework. The Free Statistics Calculators Website - Home. Sample Size Calculator - Confidence Level, Confidence Interval, Sample Size, Population Size, Relevant Population - Creative Research Systems. This Sample Size Calculator is presented as a public service of Creative Research Systems survey software.
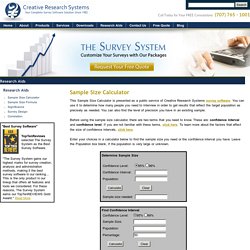
You can use it to determine how many people you need to interview in order to get results that reflect the target population as precisely as needed. You can also find the level of precision you have in an existing sample. Before using the sample size calculator, there are two terms that you need to know. These are: confidence interval and confidence level. If you are not familiar with these terms, click here. Enter your choices in a calculator below to find the sample size you need or the confidence interval you have. Interactive Statistical Calculation Pages. SOFA Statistics Open For All - Home Page. IDE/Script Editors. Rpad - Google Code. PSPP. GNU PSPP is a program for statistical analysis of sampled data.
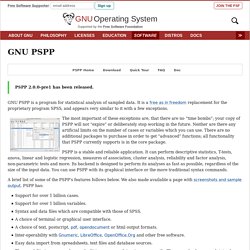
It is a Free replacement for the proprietary program SPSS, and appears very similar to it with a few exceptions. The most important of these exceptions are, that there are no “time bombs”; your copy of PSPP will not “expire” or deliberately stop working in the future. Neither are there any artificial limits on the number of cases or variables which you can use. There are no additional packages to purchase in order to get “advanced” functions; all functionality that PSPP currently supports is in the core package. PSPP is a stable and reliable application. A brief list of some of the PSPP's features follows below. Support for over 1 billion cases. PSPP is particularly aimed at statisticians, social scientists and students requiring fast convenient analysis of sampled data. Downloading PSPP As with most GNU software, PSPP can be found on the main GNU ftp server: (via HTTP) and (via FTP). Documentation.
Welcome. Homepage. Professor Rob J Hyndman. Dataplot. SOCR: Statistics Online Computational Resource. SOCR: Statistics Online Computational Resource. R Commander. John Fox and Milan Bouchet-Valat Please Read the Rcmdr Installation Notes (click on the image for a larger view) For more details, see my paper on the R Commander in the Journal of Statistical Software (which is somewhat out of date) and the introductory manual distributed with the package (accessible via the Help -> Introduction to the R Commander menu).
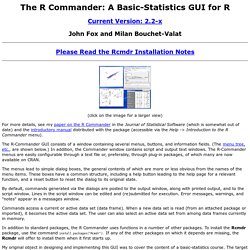
The R-Commander GUI consists of a window containing several menus, buttons, and information fields. (The menu tree, etc., are shown below.) The menus lead to simple dialog boxes, the general contents of which are more or less obvious from the names of the menu items. By default, commands generated via the dialogs are posted to the output window, along with printed output, and to the script window. MacAnova Home Page. Resources to help you learn and use SPSS. [R-sig-teaching] R Equivalent of SPSS "Split File" and "AutoRecode"
Introduction to Statistical Computing in R. A statistical package, such as SPSS or SAS, is primarily oriented toward combining instructions with rectangular case-by-variable datasets to produce (often voluminous) printouts.
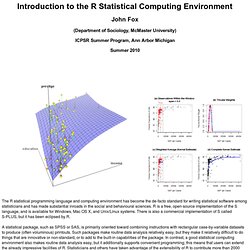
Such packages make routine data analysis relatively easy, but they make it relatively difficult to do things that are innovative or non-standard, or to add to the built-in capabilities of the package. In contrast, a good statistical computing environment also makes routine data analysis easy, but it additionally supports convenient programming; this means that users can extend the already impressive facilities of R. Statisticians and others have taken advantage of the extensibility of R to contribute more than 2000 freely available “packages” of documented R programs and data to CRAN ( the Comprehensive R Archive Network) and many others to the Bioconductor package archive. Precompiled binaries for popular Linux systems are available from CRAN, or users can compile R from source. See CRAN for details. Manuals. An Introduction to R.
Table of Contents This is an introduction to R (“GNU S”), a language and environment for statistical computing and graphics.
R is similar to the award-winning1 S system, which was developed at Bell Laboratories by John Chambers et al. It provides a wide variety of statistical and graphical techniques (linear and nonlinear modelling, statistical tests, time series analysis, classification, clustering, ...). This manual provides information on data types, programming elements, statistical modelling and graphics.
R: Statistical Software for Psychology Research. This is one page of a series of tutorials for using R in psychological research. Crush-tools - Google Code. CRUSH (Custom Reporting Utilities for SHell) is a collection of tools for processing delimited-text data from the command line or in shell scripts. For help getting started using CRUSH, or to see a demo of what it can do, try the CrushTutorial.
For a list of the utilities provided in CRUSH and links to their documentation, see the UserDocs. Or see ApplicationDevelopmentWithCrush for a detailed look at writing applications using the CRUSH toolkit. Join the CRUSH discussion group at. Piwik - Web analytics - Open source. Free-SA. Ohloh Home Page. Scruffy Graphs for Ruby People. Website Optimizer - Adwords - Google.
An Introduction to R - a tutorial for new users of R. About the Book This tutorial manual provides a comprehensive introduction to GNU R, a free software package for statistical computing and graphics. This revised and updated second edition covers the 2.9.0 release of R (April 2009), and contains additional examples, notes and corrections. You can examine the contents of the printed book here, View sample pages (individual pages in image format) View sample in PDF (contents and selected pages, 190 kB) All the money raised from the sale of this book supports the development of free software. This book is freely redistributable, under a license that permits copying and modification. Ordering You can buy the book online at the following bookstores: The manual can also be ordered from most physical bookstores using the ISBN number.
Print out the following flyer for detailed bookstore and library ordering information, Download ordering flyer in PDF format Related Titles News feed. The R Users Group at University of Arizona.