
Chrome Extensions Every Developer Should Have. Yesterday, I was having a google meet call with a developer.

In the middle of the call, she had to show me something on her github profile and so she shared her screen. The first thing I noticed was that her github was in dark mode. How cool is that, I thought? I had always hated light mode. It gave me headaches. My research led to me finding out not only about OctoTree but about some more awesome chrome extensions that I think every developer should know about and start using. 1.OctoTree : This extension enhances Github code review and exploration. Here is how it looks. How to set up the debugger for Chrome extension in Visual Studio Code. By Victor A.

Requena Debugging your web applications with Visual Studio Code makes you more efficient. It helps you save a lot of time and keeps your code cleaner. This is because you don’t have to write a bunch of console.logs and you can go through your code execution line by line. But if you’re here, you probably know the benefits of debugging web applications. Getting set up The first thing you need to do is install the Debugger for Chrome extension.
You can create the launch file by going to the debug section in the Activity Bar and clicking the gear icon. A list of options will prompt you to select the “Chrome” one. List of Chromium Command Line Switches « Peter Beverloo. How to use a command line switch? The Chromium Team has made a page on which they briefly explain how to use these switches. Conditions These are rather technical. While most are pretty self-explanatory, keep in mind that any condition means that a switch isn't always available. The constant OS_WIN must be defined. Benefit From This List of Chrome Extensions - Level Up Coding. Dev Tips - Developer Tips by Umar Hansa. Improve Your Debugging Skills with Chrome DevTools. In this post we cover best practices and tips for using Chrome Dev Tools, which will help you solve your web application development struggles more easily.

Have you ever had trouble with incorrectly executed JavaScript? Have you ever struggled with fine-tuning the CSS of the elements on your web page? Are you annoyed every time you test your web page on multiple different mobile devices? If the answer to at least one of the questions is "yes," then this blog post is meant for you. Check out our best practices and tips which will help you to deal with these struggles and boost your performance. Using the Chrome Developer Tools (DevTools for short), you can easily modify the appearance and functionality of the Telerik UI for ASP.NET AJAX components, or other UI framework components like Kendo UI widgets, on the fly.
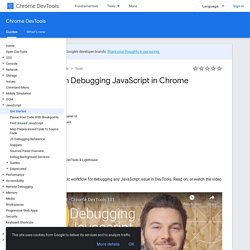
On This Page Inspect the Generated HTML of a Control There are a few possible approaches to check the rendering of a control: Figure 1. Pro Tips See the Applied Styles. Dev Tips - Developer Tips by Umar Hansa. Jkup/mastering-chrome-devtools: Website for teaching Chrome DevTools. Get Started with Debugging JavaScript in Chrome DevTools This tutorial teaches you the basic workflow for debugging any JavaScript issue in DevTools.

Read on, or watch the video version of this tutorial, below. Step 1: Reproduce the bug Finding a series of actions that consistently reproduces a bug is always the first step to debugging. Click Open Demo. The demo opens in a new tab. Step 2: Get familiar with the Sources panel UI DevTools provides a lot of different tools for different tasks, such as changing CSS, profiling page load performance, and monitoring network requests.
Open DevTools by pressing Command+Option+I (Mac) or Control+Shift+I (Windows, Linux). The Sources panel UI has 3 parts: The File Navigator pane. Step 3: Pause the code with a breakpoint A common method for debugging a problem like this is to insert a lot of console.log() statements into the code, in order to inspect values as the script executes. The console.log() method may get the job done, but breakpoints can get it done faster. Step 4: Step through the code Next steps. Chrome Platform Status. Jason Savard - Le Programmeur Vert. Web Tools - Google Developers. Navigation sécurisée – Transparence des informations – Google. Notre équipe chargée de la sécurité a conçu la fonction Navigation sécurisée pour identifier les sites Web suspects et en informer les utilisateurs et les webmasters afin qu'ils puissent se prémunir contre les attaques malveillantes.

En apportant des informations détaillées sur les menaces que nous détectons et en affichant des avertissements, nous espérons éclairer les utilisateurs sur les dangers potentiels du Web et les encourager à faire preuve de plus de prudence. Environ un milliard de personnes utilisent la fonction Navigation sécurisée de Google. Chaque semaine, nous aidons des dizaines de millions d'internautes à se prémunir contre des attaques malveillantes en affichant des avertissements dans Google Chrome, Mozilla Firefox et Apple Safari lorsqu'ils tentent d'accéder à des sites Web susceptibles de subtiliser leurs informations personnelles ou d'installer des logiciels dont le but est de prendre le contrôle de leurs ordinateurs. Des ressources pour accélérer l’intégration HTML et CSS avec Google Chrome. Aujourd'hui, je vous propose de découvrir une dizaine d'extensions pour le navigateur Google Chrome qui vous permettront de gagner du temps lors de vos intégrations.

Des ressources pour accélérer l’intégration HTML et CSS avec Google Chrome.