
Infographies. Plus de 800 infographies sur le thème du web et de ses usages. En une seule minute, une quantité monstrueuse de données est échangée sur le web.

Chaque minute de chaque heure de chaque journée. L’agence... Lorsque l’on parle de Google, Samsung ou encore Apple, on ne peut qu’avoir les yeux qui brillent quand aux montants qu’ils annoncent.... Le cloud computing est annoncé comme la technologie de demain pour tous les avantages qu’on lui connait. Mais qui utilise réellement cette technologie?... Vous êtes une entreprise et vous souhaitez vous lancer comme vos amis dans les réseaux sociaux. Les réseaux sociaux sont addictifs et personne ne peut dire le contraire.
Nous lisons de plus en plus et notamment en ligne. Foursquare est sans contest le réseau social de géolocalisation, leader sur son marché. Cette infographie présente les éléments composant un design de site web sur lesquelles jouent les web designer pour créer un site au design inédit.... Vous vous êtes toujours demandé ce à quoi ressemble ou ressemblait une chambre de geek? The Hard Knock Life of an Internet Troll. Corn Eating Personality test. 35 Cool Infographics for Web and Graphic Designers. Inspiration June 10, 2011 Let’s be honest, we tend to get bored with reading too much text and it’s rather difficult to understand descriptive information especially if they signify numbers or statistics.

To make things easier, we use graphs, illustrations and flowcharts to make them visually appealing yet, at the same time, easy to understand. One of the latest online trends that graphic designers make use of are infographics. Infographics, short for Information graphics, are said to be visual representations of a study or data. Infographics are not just mere digital artworks. To cite examples, here is a list of 30 Infographics in relation to Internet, Social Media, Graphic and Web Design. Web and Graphic Design Infographics View Source View Source View Source View Source View Source. 50 Informative and Well-Designed Infographics. It’s impossible to comprehend complex data or analyze large amounts of information, if we only use words or texts.

Information graphics or better known as infographics are visual explanation of data, information or knowledge. These graphics are excellent visual tools for explaining huge amounts of information where complex data needs to be explained immediately and clearly. Let me show you how Rick Mans explain how infographics ease the process of communicating conceptual information Image credit. Infographic is one of the most challenging types of graphic design because the creation process alone is pretty intensive.
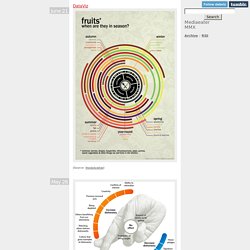
We are truly delighted to show you these brilliant and informative infographics created by various talented individuals. Recommended Reading: More Infographic related posts. 50 Years of Space Exploration. Disney vs Marvel. Grand Mosque. High Rise. Relief Wells & Subsea Containment. Prism Social Media 2010. Genes and Society: Cloning. Flickr User Model. Crude Awakening. DataViz. DataViz Mediaeater MMX Archive / RSS June 21 (Source: thedailywhat) May 26 April 30 December 5 (Source: mrharristweed) November 12 November 9 (Source: toukubo, via handa) November 3 September 3 August 15 (Source: thedailyfeed) Next »

Infographics.