
Page Not Found - Linkurious. See Graph Databases Easily. Graph Visualizations - Neo4j: The World's Leading Graph Database. Linkurio.us Neo4j Graph Visualization Neo4j Partner Linkurious helps you make sense of your graph data through a simple web-based interface based on an open-source back-end that connects to your Neo4j Database.
Connect Our Open Source backend indexes your graph so you can connect with it on Linkurious and get started in minutes. Graphing the history of philosophy « Drunks&Lampposts. A close up of ancient and medieval philosophy ending at Descartes and Leibniz If you are interested in this data set you might like my latest post where I use it to make book recommendations.
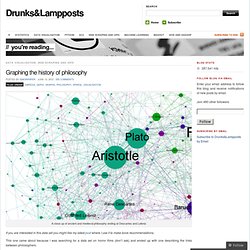
This one came about because I was searching for a data set on horror films (don’t ask) and ended up with one describing the links between philosophers. To cut a long story very short I’ve extracted the information in the influenced by section for every philosopher on Wikipedia and used it to construct a network which I’ve then visualised using gephi It’s an easy process to repeat. It could be done for any area within Wikipedia where the information forms a network. First I’ll show why I think it’s worked as a visualisation. Each philosopher is a node in the network and the lines between them (or edges in the terminology of graph theory) represents lines of influence. It gets more interesting when we use Gephi to identify communities (or modules) within the network. It has been fairly successful.
Simon. The Apache Cassandra Project. Cytoscape: An Open Source Platform for Complex-Network Analysis and Visualization. Brad's Thoughts on the Social Graph. Translations: [ Беларускі ] I've been thinking a lot about the social graph for awhile now: aggregating the graph, decentralization, social network portability, etc. If you've seen me at any conference recently, I probably talked your ear off about it. I've gotten good at my verbal/visual presentations, showing my slides , pictures of graphs, and adapting my delivery to you based on your background, facial expressions, questions, etc. This is all a lot harder to do in a blog post where the audience is so diverse, so I've been lazily putting it off. I was also afraid that if I left anything out, I'd get flooded with comments like But what about __________?
First off, before I explain what I've prototyped so far, and what I want to build (or see built) next, let me declare the problem statement, as I see it, and the underlying assumptions I've been making: Problem Statement: ¶ Facebook's answer seems to be that the world should just all be Facebook apps. Goals: ¶ Non-Goals: ¶ Assumptions: ¶ Conceptual Graphs Home Page. Gruff Lab. Introduction The Gruff Lab is the place for an early look at new features coming soon.
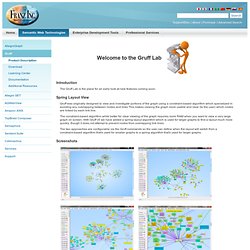
Spring Layout View Gruff was originally designed to view and investigate portions of the graph using a constraint-based algorithm which specialized in avoiding any overlapping between nodes and links This makes viewing the graph more usable and clear (to the user) which nodes are linked by each link line. The constraint-based algorithm while better for clear viewing of the graph requires more RAM when you want to view a very large graph on screen. With Gruff v5 we have added a spring layout algorithm which is used for larger graphs to find a layout much more quickly, though it does not attempt to prevent nodes from overlapping link lines. The two approaches are configurable via the Gruff commands so the user can define when the layout will switch from a constraint-based algorithm that's used for smaller graphs to a spring algorithm that's used for larger graphs.
Screenshots Data files Installation Support. What's happening in the Topic Maps world? Graphs in the database: SQL meets social networks – techPortal. Hypergraph - Hyperbolic graphs and trees : Home.