
Color example code: colormaps_reference.py — Matplotlib 2.0.2 documentation. (Source code) """==================Colormap reference================== Reference for colormaps included with Matplotlib.
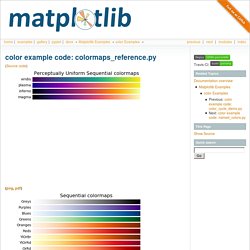
This reference example shows all colormaps included with Matplotlib. Text introduction — Matplotlib 1.5.0 documentation. Matplotlib has excellent text support, including mathematical expressions, truetype support for raster and vector outputs, newline separated text with arbitrary rotations, and unicode support.
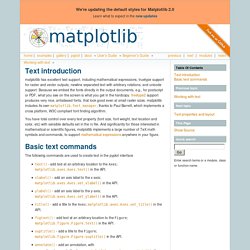
Because we embed the fonts directly in the output documents, e.g., for postscript or PDF, what you see on the screen is what you get in the hardcopy. freetype2 support produces very nice, antialiased fonts, that look good even at small raster sizes. matplotlib includes its own matplotlib.font_manager, thanks to Paul Barrett, which implements a cross platform, W3C compliant font finding algorithm. You have total control over every text property (font size, font weight, text location and color, etc) with sensible defaults set in the rc file.
And significantly for those interested in mathematical or scientific figures, matplotlib implements a large number of TeX math symbols and commands, to support mathematical expressions anywhere in your figure. (Source code, png, hires.png, pdf) Python - setting y-axis limit in matplotlib. Les histogrammes avec Matplotlib. Pyplot tutorial. Matplotlib.pyplot is a collection of command style functions that make matplotlib work like MATLAB.
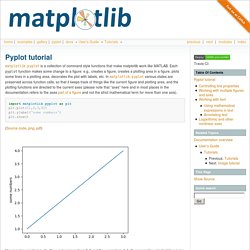
Each pyplot function makes some change to a figure: e.g., creates a figure, creates a plotting area in a figure, plots some lines in a plotting area, decorates the plot with labels, etc. In matplotlib.pyplot various states are preserved across function calls, so that it keeps track of things like the current figure and plotting area, and the plotting functions are directed to the current axes (please note that “axes” here and in most places in the documentation refers to the axespart of a figure and not the strict mathematical term for more than one axis). import matplotlib.pyplot as pltplt.plot([1,2,3,4])plt.ylabel('some numbers')plt.show()
Python - matplotlib share x axis but don't show x axis tick labels for both, just one. Legend guide — Matplotlib 1.4.3 documentation. This legend guide is an extension of the documentation available at legend() - please ensure you are familiar with contents of that documentation before proceeding with this guide.
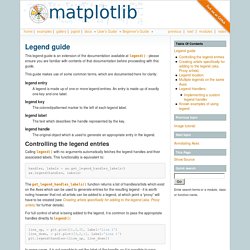
This guide makes use of some common terms, which are documented here for clarity: legend entry A legend is made up of one or more legend entries. Python - matplotlib: combine different figures and put them in a single subplot sharing a common legend. Python - surface plots in matplotlib. Nbviewer.ipython.org/github/jrjohansson/scientific-python-lectures/blob/master/Lecture-4-Matplotlib.ipynb. The figure above is functional, but it does not (yet) satisfy the criteria for a figure used in a publication.
First and foremost, we need to have LaTeX formatted text, and second, we need to be able to adjust the font size to appear right in a publication. Matplotlib has great support for LaTeX. All we need to do is to use dollar signs encapsulate LaTeX in any text (legend, title, label, etc.). Cookbook/Matplotlib/Show colormaps - Show Matplotlib colormaps Toggle line numbers 1 from pylab import * 2 from numpy import outer 3 rc('text', usetex=False) 4 a=outer(arange(0,1,0.01),ones(10)) 5 figure(figsize=(10,5)) 6 subplots_adjust(top=0.8,bottom=0.05,left=0.01,right=0.99) 7 maps=[m for m in cm.datad if not m.endswith("_r")] 8 maps.sort() 9 l=len(maps)+1 10 for i, m in enumerate(maps): 11 subplot(1,l,i+1) 12 axis("off") 13 imshow(a,aspect='auto',cmap=get_cmap(m),origin="lower") 14 title(m,rotation=90,fontsize=10) 15 savefig("colormaps.png",dpi=100,facecolor='gray') But, what if I think those colormaps are ugly?
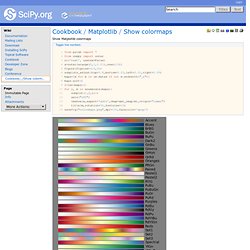
Well, just make your own using matplotlib.colors.LinearSegmentedColormap. First, create a script that will map the range (0,1) to values in the RGB spectrum. Graphiques — FAQPython 2.0 documentation. Tracer les courbes — Bien démarrer avec Numpy/Scipy/Matplotlib valpha documentation. Tables RGB Tables. Matplotlib : "Forcer" l'échelle des axes. Python - How do I set figure title and axes labels font size in matplotlib?