Create and share visual ideas online.
Venn Diagram Maker to Draw Venn Diagrams Online. Create Venn Diagrams. Log In Start Drawing Gliffy's Venn diagrams: the perfect intersection of power and convenience A Venn diagram is a simple way to represent the relationships between groups of things with a clear, visual display.
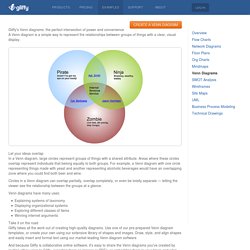
Let your ideas overlap In a Venn diagram, large circles represent groups of things with a shared attribute. Circles in a Venn diagram can overlap partially, overlap completely, or even be totally separate — letting the viewer see the relationship between the groups at a glance. Venn diagrams have many uses: Explaining systems of taxonomyDisplaying organizational systemsExploring different classes of itemsWinning internet arguments Take it on the road Gliffy takes all the work out of creating high-quality diagrams. And because Gliffy is collaborative online software, it's easy to share the Venn diagrams you've created by inviting other users to Gliffy, exporting them as images or PDFs, or embedding them in your blogs and wikis.
Useful Links Gliffy Products Use Gliffy As © 2017 Gliffy, Inc. Venn Diagram. Create and design your own charts and diagrams online. OnlineChart Tools tutoriel. Sketchboard.io - Visual Remote Teamwork. Online Diagram Software to draw Flowcharts, UML & more. Flow Chart Maker & Online Diagram Software. Gliffy Diagrams. Create diagrams online Real time collaboration - Cacoo Academic Plan. Piktochart : Make Information Beautiful. Online Diagram Software and Flowchart Software - Gliffy. For Teachers. Oomfo - PowerPoint Plugin for Creating Smarter Charts.
Application Web pour la création d'Infographie et de Contenu Visuel By PixCone. Infographics. Create Interactive Online Presentations, infographics, animations & banners in HTML5 - Visme by Easy WebContent. Create Easy Infographics, Reports, Presentations. Create and share visual ideas online. Gapminder : les grandes tendances mondiales à la portée de tous. « Les hommes politiques ne connaissent la misère que par les statistiques.
On ne pleure pas devant les chiffres. » Abbé Pierre La connaissance des phénomènes mondiaux à grande échelle (pauvreté/richesse, santé, éducation, etc.) s'appuie traditionnellement sur les données statistiques. Des chiffres qui sont rarement parlants pour les néophytes, si tant est qu'ils soient accessibles. Paradoxe : en ces temps de mondialisation triomphante, et malgré l'accumulation de données fiables depuis environ un siècle, le sens des tendances de fond nous échappe toujours. Dit autrement : alors que jamais les hommes n'ont été si mobiles et si connectés, faussement omniscients, il leur est toujours aussi difficile de prendre de la hauteur pour analyser le passé et tenter de comprendre le présent.
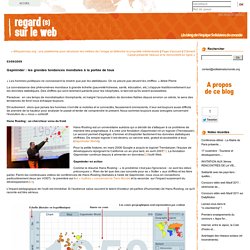
Hans Rosling : un chercheur venu du froid Hans Rosling est un universitaire suédois qui a décidé de s'attaquer à ce problème de manière très pragmatique. Gapminder en action Le Web comme outil pédagogique. Unsupported Browsers. Timeline. Home › Parent & Afterschool Resources › Games & Tools Tool Why Use This Tool Here's What To Do More Ideas To Try Send Us Feedback Why Use This Tool.