
*WhyDataLiteracyMatters. An IMLS-Funded Project of the University of Michigan School of Information and University Library. *Data Literacy is Essential to Modern Society. *Write a report. This is no time to be suggesting more work for any exhausted educator.
Nevertheless, this is the perfect time to suggest going just one step further. Please write an annual report. Now, more than ever, it matters. For some of you, this is a regular, end-of-year ritual from which you pull on notes, photos, and videos collected over the months. For some of you, this is a task in which you never before engaged. I know how hard so many of you worked to support students, teachers, and administrators during the crisis.
Why a report? It ensured that others recognized the impact of my work on our learning culture. Why now? Here are several compelling reasons why this is the year you must start documenting your impact. It’s important that any report reflects on both pre-pandemic and during pandemic activity. School boards will be negotiating crisis budget decisions between now and July 1. It doesn’t have to be lengthy. Choose a favorite platform: And, consider sharing your report with: City Digits Project. Kathy Schrock's Guide to Infographics as Assessments. The beauty of data visualization - David McCandless. To create his infographic about nutritional supplements, it took McCandless a month to review about 1,000 medical studies and design the visual.
Is that level of effort surprising, and do you think it’s worth it? Try out the interactive version that’s available on McCandless’s website. What engaged or surprised you? What, if anything, would you change to improve the user experience? Write a brief review and post it to the site. Blog. Wired has a fascinating article out about a newly-released and free facial recognition tool that, coupled with existing video monitoring, claims to keep schools safer.

From the article by Issie Lapowski: “RealNetworks has developed a facial recognition tool that it hopes will help schools more accurately monitor who gets past their front doors. Today, the company launched a website where school administrators can download the tool, called SAFR, for free and integrate it with their own camera systems … [F]acial recognition technology often misidentifies black people and women at higher rates than white men. “The use of facial recognition in schools creates an unprecedented level of surveillance and scrutiny,” says John Cusick, a fellow at the Legal Defense Fund. Why Kids Need Data Literacy, and How You Can Teach It. Samantha Viotty’s activity for visualizing data networks has gummy bears representing people and toothpicks signifying their relationships.
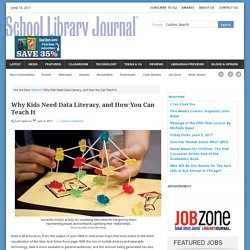
Photo courtesy of Samatha Viotty Data is all around us, from the output of your Fitbit to interactive maps that track voters to the latest visualization of the New York Times front page. With the rise of mobile devices and wearable technology, data is more available to general audiences, and the amount being generated has also exploded. According to IBM, 90 percent of the world’s data has been created in the last two years.
This vast pool of information is being used to advocate for change, justify decisions, and suggest personal action plans—such as the U.S. One reason data literacy is vital is that “[i]n what some are calling a ‘post-truth world,’ students seem to focus on numbers a lot,” says Jo Angela Oehrli, learning librarian/children’s literature librarian at the University of Michigan Libraries. Virtual Conference on Data Literacy. “Thank you for the excellent virtual conference as well as all the extraordinary work you are doing.
I am looking forward to sharing your site with our faculty.” – 2018 participant Our three-year conference has come to a close. [click to download as PDF] Looking for sessions from the 2016 and 2017 conferences? You can find them here. Partners in the parent 4T Virtual Conference include: Livingston Educational Service Agency (LESA), Oakland Schools, and Washtenaw ISD.
Infographics. Data Literacy for High School Librarians. We’ve been busy tapping away on Creating Data Literate Students, a guide to integrate the “reading” and “writing” of data.
How do students learn to “read” and “write” data with accuracy? Given how jam-packed high school curriculum is, it isn’t practical for teachers to add a unit or course on data or statistical literacy to the curriculum. What are the tips, rules of thumb, and guidelines that would make the greatest impact in the limited time available? Our chapters are now available for you to read and download, and by the end of Summer 2017, we’ll have copies available to purchase on Amazon or download in a machine-readable format, too. Don’t see your favorite contributor here? Cover. How to spot a misleading graph - Lea Gaslowitz. 100 People: A World Portrait. The beauty of data visualization - David McCandless. Four Out of Five Dentists Say Coca-Cola Cures Cancer!: Data Literacy Strategies to Help Patrons Identify Fake – or Just Bad – Information.
Creating Visual Stories With Data.