
Assertions. Work. 10 Steps To Designing An Amazing Infographic. Information can be useful—and even beautiful—but only when it’s presented well.
In an age of information overload, any guidance through the clutter comes as a welcome relief. That’s one reason for the recent popularity of information graphics. Infographics are visual designs that help to explain complicated data in a simple way (mental-health emergencies at Burning Man, anyone?). Datavisualization.ch Selected Tools. Posters. The Institute of Play pioneers new models of learning and engagement.
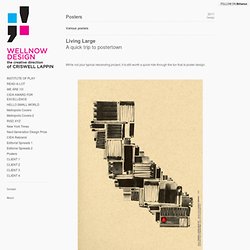
A not-for-profit design studio, founded in 2007 by a group of game designers in New York City, the Institute is now home to an interdisciplinary team of designers, strategists and learning practitioners. I led the creative team and co-founder a research and development lab called ABLE.Branding, Entrepreneurship, UI/UX2014 Part of the WE ARE 10! Challenge- Find use for a transparent technology where the transparency adds value. Branding, Entrepreneurship, Product Design2014. Do College Freshmen Feel Academically Prepared for Classes? (Scaling) UW DESIGN SHOW 2010. Infographs. The Office of Feltron.com. Infographic: Oscar Niemeyer’s timeline - Niemeyer_timetable_ok (192695) - ArchDaily. 15 examples. Data Visualization is a method of presenting information in a graphical form.

Good data visualization should appear as if it is a work of art. This intrigues the viewer and draws them in so that they can further investigate the data and info that the graphic represents. Ideas, issues, concepts, subjects - v. 15 examples.