
Spreadsheetjournalism. Real-Time Data And A More Personalized Web - Smashing Magazine. Advertisement As Web designers, we face a daily struggle to keep pace with advances in technology, new standards and new user expectations.
We spend a large part of our working life dipping in and out of recent developments in an attempt to stay both relevant and competitive, and while this is what makes our industry so exciting to be a part of, it often becomes all too easy to get caught up in the finer details. Responsive Web design, improved semantics and rich Web typography have all seen their fair share of the limelight over the last year, but two developments in particular mark true milestones in the maturation of the Web: “real-time data” and a more “personalized Web.” Since the arrival of the new Web, we’ve been enraptured by social media. We share links, we “follow,” we “poke,” we’ve become accustomed to it all. Web gurus and industry analysts are simultaneously arriving at the same conclusion: we are entering a new chapter in the evolution of the Web. Welcome to the new era.
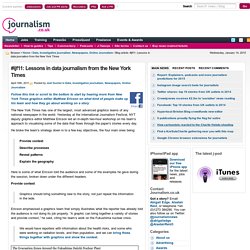
Ddo. MyDataNews's Données Bookmarks on Delicious. #ijf11: Lessons in data journalism from the New York Times. Follow this link or scroll to the bottom to start by hearing more from New York Times graphics editor Matthew Ericson on what kind of people make up his team and how they go about working on a story The New York Times has one of the largest, most advanced graphics teams of any national newspaper in the world.
Yesterday at the International Journalism Festival, NYT deputy graphics editor Matthew Ericson led an in-depth two-hour workshop on his team’s approach to visualising some of the data that flows through the paper’s stories every day. He broke the team’s strategy down in to a few key objectives, the four main ones being: Provide contextDescribe processesReveal patternsExplain the geography Here is some of what Ericson told the audience and some of the examples he gave during the session, broken down under the different headers.
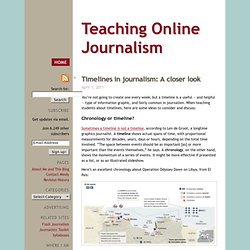
Provide context Graphics should bring something new to the story, not just repeat the information in the lede. Describe processes From nuclear meltdown to dancing. Datablog.owni.fr. Influence Networks: The six degrees of investigative journalism. In October, 2010, during the Personal Democracy Forum in Barcelona, several investigative journalists explained how they managed to uncover corruption using network analysis. One of them, Dejan Milovac, wrote a story about a construction project on the Montenegrin coastline. He deconstructed the financial networks around the resort, and showed how local politicians were involved in an enterprise that was ostensibly going against all environmental rules. Below is the image illustrating result of the investigation: This diagram holds some margin for improvement, beginning with readability.
What’s more, the relationships exposed in this investigation could be useful to other journalists working on similar subjects. Network analysis has become a popular topic in several newsrooms. On the geekier side, Little Sis is another database of relations. Teaching Online Journalism » Timelines in journalism: A closer look. You’re not going to create one every week, but a timeline is a useful — and helpful — type of information graphic, and fairly common in journalism.
When teaching students about timelines, here are some ideas to consider and discuss: Teaching Online Journalism » 10 useful resources about data visualization. Think Quarterly. A computational journalism reading list. [Last updated: 18 April 2011 -- added statistical NLP book link] There is something extraordinarily rich in the intersection of computer science and journalism.
It feels like there’s a nascent field in the making, tied to the rise of the internet. The last few years have seen calls for a new class of “programmer journalist” and the birth of a community of hacks and hackers. Meanwhile, several schools are now offering joint degrees. But we’ll need more than competent programmers in newsrooms. I’d like to propose a working definition of computational journalism as the application of computer science to the problems of public information, knowledge, and belief, by practitioners who see their mission as outside of both commerce and government.
L’ouverture des données publiques, et après ? » Article » OWNI, Digital Journalism. Daniel Kaplan, directeur de la Fing, explore les conséquences de l'ouverture des données publiques et leur réutilisation.

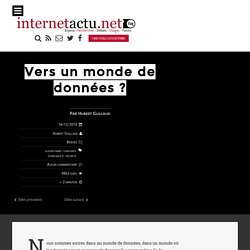
Big Data : Making sense at scale. D'un récent voyage dans la Silicon Valley (merci aux amis du Orange Institute), je rentre avec une conviction : tout ce que nous connaissions du web va changer à nouveau avec le phénomène des big data.
Il pose à nouveau, sur des bases différentes, presque toutes les questions liées à la transformation numérique. En 2008, l’humanité a déversé 480 milliards de Gigabytes sur Internet. En 2010, ce furent 800 milliards de Gygabytes, soit, comme l’a dit un jour Eric Schmidt, plus que la totalité de ce que l’humanité avait écrit, imprimé, gravé, filmé ou enregistré de sa naissance jusqu’en 2003. Ces données ne sont pas toutes des oeuvres. Journalism in the Age of Data: A Video Report on Data Visualization by Geoff McGhee. 3 Tips for Engaging Online Communities with Data Visualization. Data visualization is a medium for understanding information that had previously been the domain of scientists and researchers.
Today, due to the amount of data available, there is an increasing need to find new ways of understanding what information means that is available through social networks and throughout the Web. Engaging Online Communities is a report we published this week that explores ways to engage with customers. It looks at the tools available to engage, collect and analyze information.
Vers un monde de données. Nous sommes entrés dans un monde de données, dans un monde où les données sont en passe de devenir l’essence même de la connaissance et de l’information.
Visualisation de données : rencontre avec David McCandless » Article » OWNI, Digital Journalism. Le journaliste du Guardian tient le site "Information is beautiful", sur lequel il met en scène toutes sortes de données.
Data and Visualization: Predictions for 2011. A lot of my time these days goes into planning DataMarket‘s efforts in the new year.
An essential part of that is trying to grasp the major trends in areas that matter to us. DataMarket is building an active marketplace for statistics and structured data.