
Cognos Pricing - IBM Cognos BI Price List. SAP BusinessObjects Pricing - SAP BI Software Price. Best Tableau Alternatives for Your Business in 2018. Qlik Sense Qlik is a heavyweight in the self-service BI market.

While Qlik also offers a guided analytics solution known as Qlik View, the Qlik Sense offering is more directly comparable to Tableau Desktop. Whereas Tableau only offers a 14-day trial version of Tableau Desktop, Qlik Sense Desktop is free for a single user. Qlik Sense Desktop only works on Windows, while Tableau Desktop also works on Mac OS.
One important difference between Tableau and Qlik Sense is that Tableau Desktop must be installed on a computer or mobile device, whereas Qlik also offers a cloud-based version of their desktop client that can be accessed with a standard web browser. Like Tableau Desktop, Qlik Sense Desktop focuses on data discovery via interactive visualizations. Multiple visualizations can then be combined into integrated dashboards. Best Tableau Alternatives for Your Business in 2018. Qlik Sense.

Best Tableau Alternatives for Your Business in 2018. Qlik Sense Qlik is a heavyweight in the self-service BI market.
While Qlik also offers a guided analytics solution known as Qlik View, the Qlik Sense offering is more directly comparable to Tableau Desktop. SAP BusinessObjects Pricing - SAP BI Software Price. Best Tableau Alternatives for Your Business in 2018. Qlik Sense Qlik is a heavyweight in the self-service BI market.

While Qlik also offers a guided analytics solution known as Qlik View, the Qlik Sense offering is more directly comparable to Tableau Desktop. Whereas Tableau only offers a 14-day trial version of Tableau Desktop, Qlik Sense Desktop is free for a single user. Qlik Sense Desktop only works on Windows, while Tableau Desktop also works on Mac OS. DOJO - It's your city. Intro to ArcGIS. What is ArcGIS? 8 tools for visualizing data with open source. Data visualization is the mechanism of taking tabular or spatial data and conveying it in a human-friendly and visual way.
There are several open source tools that can help you create useful, informative graphs. In this post we will take a look at eight open source, data visualization tools. Datawrapper Datawrapper was created by journalism organizations from Europe, designed to make data visualization easy for news institutes. How to Measure Area and Distance in Google Maps & Earth. Did you know that both Google Maps and Google Earth include tools that will automatically measure both distance and area for you?
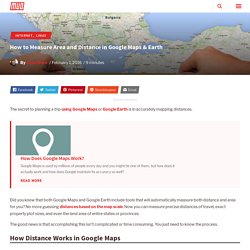
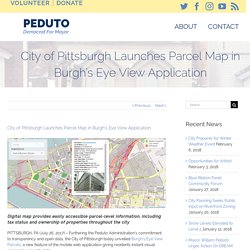
No more guessing distances based on the map scale. Now you can measure precise distances of travel, exact property plot sizes, and even the land area of entire states or provinces. The good news is that accomplishing this isn’t complicated or time consuming. You just need to know the process. City of Pittsburgh Launches Parcel Map in Burgh’s Eye View Application. Digital map provides easily accessible parcel-level information, including tax status and ownership of properties throughout the city.
Tracking Progress, Inspiring Action. DataLA: Information, Insights, and Analysis from the City of Angels. City of Chicago. DataLA: Information, Insights, and Analysis from the City of Angels. A Profile of Technology and Innovation in Chicago. In the past few years, many big cities have revolutionized their use of municipal data.
Rather than serving as a static archive, municipal data is becoming a dynamic tool for government transparency, efficiency, and innovation. In no place is this truer than in Chicago, where advances in open data and big data analytics under Mayor Rahm Emanuel have helped the city emerge as a leader in data science and open government. Before his inauguration, Emanuel set an ambitious agenda that specifically called for technology to lead the way for more government efficiency and transparency.
The Chicago 2011 Transition Plan, a 71-page document that laid out the new administration’s key goals and strategies, included provisions to use an open data model to publicize city records and to centralize and consolidate many of the city’s internal service operations. Chicago’s WindyGrid: Taking Situational Awareness to a New Level. Monitoring a city’s functions is like monitoring a patient’s vital signs—its transportation of people like a pulse, emergency services like a respiratory rate, and so forth.
Thus, when a major incident or event occurs, the whole urban system can be affected. If municipal leaders could wholly understand their city’s vital signs, they could not only better manage their cities, but take preventative measures to ensure the city’s health remains intact. The challenge, however, is finding the right tools to holistically monitor a city’s health. Structured Dynamics. Burgh’s Eye View. The proliferation of civic tech projects has led to a growing number of vendors who offer off-the-shelf products for cities and municipalities.
At the National League of Cities summit, which brought over 3,500 elected officials and city staffers to Pittsburgh in November 2016, the exhibition hall was full of companies looking to connect with municipal representatives. For many of their needs – a platform for better civic engagement, a tool to track legislation, an application to visualize permit data – private industry offers a modern, customizable, low-barrier solution. While this kind of partnership has led to advent of many notable civic tech projects, off-the-shelf solutions often require trade-offs, such as high purchase costs or a potential disinvestment in a city’s capacity to develop its own products. The Region's Open Data at Your Fingertips.
Burgh's Eye View Points. Ok, so how do I use it? Burgh’s Eye View uses maps to visualize data generated by the City of Pittsburgh and its residents. Discover QGIS. 13 Free GIS Software Options: Map the World in Open Source. Last Updated: Jan 9, 2018 You don’t have to pay a king’s ransom to map the world. This is because you can do it all with free GIS software. The best part is: These free GIS software give you the firepower to get the job done as if you’re working with commercial GIS software. Streetlight Vision Central Management Software. Streetlight Vision Central Management Software Unlike most software on the market, the Streetlight Vision Central Management Software is not a basic web page displaying light points on Google Maps. It provides a secured, scalable and managed web application software, including rich-web user interface to control, command, configure, commission and monitor any type of smart streetlight or smart city device from any authorized PC, MAC, smart phones or tablets.
The real time map-based interface enables authorized maintenance teams to act remotely on any individual streetlight to verify any situation before triggering expensive onsite trips. With more than 500 features, the Streetlight.Vision Central Management Software is the most advanced Smart Streetlight Software. Its user-friendly web user interface provides a flexible web desktop with a large number of web applications for all authorized users.
Real Time App allows you to monitor and control your assets in real time. Open Grid Systems. GridⓘView is a mobile application that provides important asset and network information to personnel in the field. GridⓘView allows the user to visualise consolidated GIS, network and asset health data around their location on both a map and augmented reality view. By providing a variety of information the field crews are able to identify the equipment around them and invoke storm damage requests, view asset incidents or send update GIS requests at the touch of a button. This removes the need for paper forms, multiple integration of data into different systems and human error. GridⓘView provides a means of saving time and money for field crews. IBM CEO: 'Do Not Be Afraid' Of The All-Powerful Computer We're Building.
Hal 9000, the all-powerful super computer from 2001: A Space Odyssey.MGM DisclaimerGet real-time IBM charts here » As most of the world knows by now, IBM has created a computer called Watson that is, arguably, the smartest, most human-like computer ever built. Most folks know Watson as the computer that won the Jeopardy game some years ago. Watson had to understand verbal language to win, a hard thing for a computer to do well (as Siri users will attest).
Since the days of Jeopardy, Watson has been helping doctors fight cancer. Netflix Is 'Training' Its Recommendation System By Using Amazon's Cloud To Mimic The Human Brain. Recommendation Engines: How Amazon and Netflix Are Winning the Personalization Battle. Download Sandia’s Microgrid Design Toolkit (MDT) Sandia National Laboratories developed the Microgrid Design Toolkit (MDT), decision support software for microgrid designers, is now publicly available for download. Smart Cities tools for better public services across Europe. LOCAL GOVERNMENT CITIZEN INSIGHT Understand the types of people that live across the EU, their preferences and their likely demand for public services. Sentilo. The Most Digital Companies Are Leaving All the Rest Behind. The United States takes pride in being on the cutting edge of all things digital, and rightly so: American innovations and innovators have led the way.
Yet according to recent research from the McKinsey Global Institute, the U.S. economy operates at only 18% of its digital potential, and the sort of productivity gains that digital technologies should be enabling are not showing up in the broader economy. A Chart That Shows Which Industries Are the Most Digital (and Why)
When business leaders talk about going digital, many are uncertain about what that means beyond buying the latest IT system. Companies do need assets like computers, servers, networks, and software, but those purchases are just the start. Digital leaders stand out from their competitors in two ways: how they put digital to work, especially in engaging with clients and suppliers, and how intensively their employees use digital tools in every aspect of their daily activities. Recent research from the McKinsey Global Institute (MGI) looked at the state of digitization in sectors across the U.S. economy and found a large and growing gap between sectors, and between companies within those sectors.
The most digital companies see outsized growth in productivity and profit margins. But what are the key attributes of a digital leader? Digital assets across the entire economy doubled over the past 15 years, as firms invested not just in IT but in digitizing their physical assets. Index. 2016 Reviews of the Most Popular Systems. 2,000+ businesses use Capterra each week to find the right software. eMaint has been helping organizations around the globe implement world-class maintenance operations with its cloud-based CMMS solutions for nearly 30 years. eMaint saves companies valuable time and money by better organizing, planning and managing maintenance activities. eMaint can be tailored to meet the exact specifications of any maintenance department, and can be accessed across multiple locations in multiple languages from any browser-based device.
IBM Watson Analytics Getting Started. IBM Watson: How it Works. Using Watson Analytics and Twitter data to explore energy consumption. Research Membership. Lux Research members get on-demand access to Lux's analysts, publications, and data, across a set of emerging technology domains customized to their needs. Analysts with deep expertise in each domain provide ongoing market intelligence and technology scouting to help executives find new business opportunities and make better decisions.
Lux Research. Enhanced EnergyPoints SaaS lets users set goals for energy, emissions, cost on normalized basis - FMLink. By Brianna Crandall — December 20, 2013—Energy Points Inc., a Boston-based source-to-site energy resource analytics company, recently announced significant enhancements to its EnergyPoints Analytics software-as-a-service (SaaS) platform, including the ability to enable users to set and track energy-, emissions- and cost-reduction goals on a user-defined, normalized basis.
EnergyPoints Analytics™ Offers Powerful New Features to Enable Organizations to Reduce Energy Costs and Use. Technology Scouting and Market Research in Emerging Technologies. Interview: Ory Zik, Founder, Energy Points.