
China to increase weather manipulation program. Arctic melt releasing ancient methane. 20 May 2012Last updated at 12:54 ET By Richard Black Environment correspondent, BBC News Many of the sites were bubbling methane that has been stored for millennia Scientists have identified thousands of sites in the Arctic where methane that has been stored for many millennia is bubbling into the atmosphere.
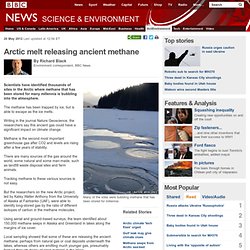
The methane has been trapped by ice, but is able to escape as the ice melts. Writing in the journal Nature Geoscience, the researchers say this ancient gas could have a significant impact on climate change. Methane is the second most important greenhouse gas after CO2 and levels are rising after a few years of stability. There are many sources of the gas around the world, some natural and some man-made, such as landfill waste disposal sites and farm animals. Tracking methane to these various sources is not easy. Using aerial and ground-based surveys, the team identified about 150,000 methane seeps in Alaska and Greenland in lakes along the margins of ice cover. North America swelters in March heat. The springtime began to feel more like summer for most of North America.
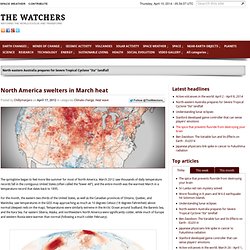
March 2012 saw thousands of daily temperature records fall in the contiguous United States (often called the “lower 48”), and the entire month was the warmest March in a temperature record that dates back to 1895. For the month, the eastern two-thirds of the United States, as well as the Canadian provinces of Ontario, Quebec, and Manitoba, saw temperatures in the GISS map approaching as much as 10 degrees Celsius (18 degrees Fahrenheit) above normal (deepest reds on the map). Temperatures were similarly extreme in the Arctic Ocean around Svalbard, the Barents Sea, and the Kara Sea. Far eastern Siberia, Alaska, and northwestern North America were significantly colder, while much of Europe and western Russia were warmer than normal (following a much colder February). East of the Rocky Mountains, 25 states had their warmest March on record; 15 more states were in their top ten warmest.
GISS Surface Temperature Analysis. The US and Maldives endure the long, hot March of climate change. The Pentagon knows it.
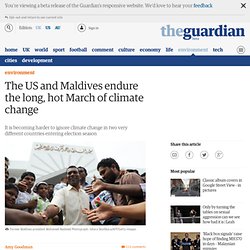
The world's largest insurers know it. Now, governments may be overthrown because of it. It is climate change, and it is real. According to the US National Oceanic and Atmospheric Administration, last month was the hottest March on record for the United States since 1895, when records were first kept, with average temperatures of 8.6F above average. More than 15,000 March high-temperature records were broken nationally. Across the world in the Maldives, rising sea levels continue to threaten this Indian Ocean archipelago. In February, Nasheed was ousted from his presidency at gunpoint. Nasheed is the subject of a new documentary, The Island President, in which his remarkable trajectory is traced. While no direct link has been found yet between Nasheed's climate activism and the coup, it was clear in Copenhagen in 2009 that he was a thorn in the Obama administration's side.
Texas lists 1,000 of the state's 4,710 community water systems under restrictions. CO2 'drove end to last ice age' Google artists create a real-time 'Wind Map' Two technology artists who head Google's "Big Picture" visualization research group debuted a new project this week that shows a time-lapse animation of wind speeds across the U.S.
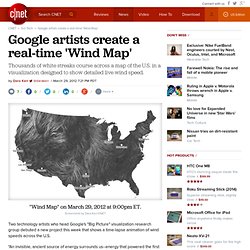
"An invisible, ancient source of energy surrounds us--energy that powered the first explorations of the world, and that may be a key to the future," the artists wrote in a post yesterday. "This map shows you the delicate tracery of wind flowing over the US right now. " The black map, simply named "Wind Map," displays white streaks that show varying wind speeds from 1 to 30 miles per hour.
Wind Map. An invisible, ancient source of energy surrounds us—energy that powered the first explorations of the world, and that may be a key to the future.

This map shows you the delicate tracery of wind flowing over the US. The wind map is a personal art project, not associated with any company. We've done our best to make this as accurate as possible, but can't make any guarantees about the correctness of the data or our software. Please do not use the map or its data to fly a plane, sail a boat, or fight wildfires :-) If the map is missing or seems slow, we recommend the latest Chrome browser.
Surface wind data comes from the National Digital Forecast Database. If you're looking for a weather map, or just want more detail on the weather today, see these more traditional maps of temperature and wind. State_of_the_Planet_Declaration.pdf (Objet application/pdf)