
Ainsi font font font… la glace Arctique (en 1 minute chrono) Ce qui est bien avec la vidéo "en accéléré" ("time-lapse" in english), c'est que si vous avez raté des épisodes, on vous résume l'histoire en quelques secondes.

Alors la glace Arctique, font-elle ? Affirmatif ! Cette séquence décrit l'évolution de la banquise Arctique entre 1987 et 2013. Voici donc 25 ans de fonte des glaces en 1 minute chrono. Cette vidéo a été réalisée grâce à la NOAA (National Oceanic and Atmospheric Administration), autrement dit l'agence américaine qui s'occupe de surveiller et d'étudier les océans et l'atmosphère, dont voici ci-dessous le logo... ...et la vidéo ICI . Quelques conséquences climatologiques et géopolitiques de la fonte des glaces Cette fonte des glaces devrait avoir, à terme, un impact sur la faune, la flore, mais aussi certainement sur le climat régional de l'Arctique, et, par voix de conséquence, sur la géopolitique de l'Arctique.
On lit parfois que l'océan Arctique serait bientôt "libre de glace". 2014: Sea ice data updated daily with one-day lag. The year 2019 saw an early melt onset and high sea surface temperatures during summer in the Beaufort and Chukchi Seas.
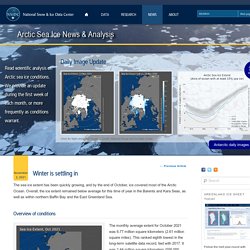
The September minimum extent ended up tied with 2007 and 2016 for second lowest in the satellite record. Autumn freeze up was slow. In December, the Chukchi Sea finally completely refroze, Hudson Bay iced over, and sea ice extended south into the Bering Sea. The year 2019 still ended up with low extent in the Bering Sea. Taking a longer view, the defining feature of the decade of the 2010s was consistently low Arctic sea ice extent compared to long-term averages. Overview of conditions. 2013 Wintertime Arctic Sea Ice Maximum Fifth Lowest on Record. Arctic sea ice delusions strike the Mail on Sunday and Telegraph. When it comes to climate science reporting, the Mail on Sunday and Telegraph are only reliable in the sense that you can rely on them to usually get the science wrong.
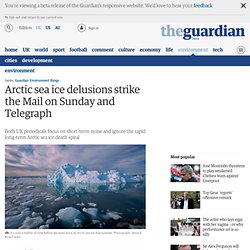
This weekend's Arctic sea ice articles from David Rose of the Mail and Hayley Dixon at the Telegraph unfortunately fit that pattern. Both articles claimed that Arctic sea ice extent grew 60 percent in August 2013 as compared to August 2012. While this factoid may be technically true (though the 60 percent figure appears to be an exaggeration), it's also largely irrelevant.
For one thing, the annual Arctic sea ice minimum occurs in September – we're not there yet. And while this year's minimum extent will certainly be higher than last year's, that's not the least bit surprising. "Around 80% of the ~100 scientists at the Bjerknes [Arctic climate science] conference thought that there would be MORE Arctic sea-ice in 2013, compared to 2012.
" World of Change: Arctic Sea Ice : Feature Articles. Layers of frozen seawater, known simply as sea ice, cap the Arctic Ocean.

Ice grows dramatically each winter, usually reaching its maximum in March. It melts just as dramatically each summer, generally reaching its minimum in September. These image pairs show Arctic sea ice concentration for the month of September (left) and the following March (right) for a time series beginning in September 1999 and ending in March 2014. The yellow outline on each image shows the median sea ice extent observed by satellite sensors in September and March from 1979 through 2000. Arctic sea ice falls to fifth lowest level on record. Arctic sea ice remained on its death spiral on Wednesday, with the amount of winter ice cover falling to its fifth lowest on the satellite record, scientists at the National Snow and Ice Data Center said.

The scientists said Arctic sea ice extent for March averaged 14.80m sq km. That's 730,000 sq km below the 1981-2010 satellite average. The latest findings reinforce a trend that could see the Arctic losing all of its ice cover in the summer months within decades. The world's leading scientists this week admitted that Arctic sea ice was disappearing much faster than expected. “The decline of Arctic sea ice in summer is occurring at a rate that exceeds most model projections,” the United Nations' intergovernment panel on climate change said in releasing its first report since 2007.