
GitHub - openplans/Leaflet.AnimatedMarker: A Leaflet plugin to animated a Marker along a polyline. Leaflet.AnimatedMarker/demo.js at master · clhenrick/Leaflet.AnimatedMarker. LeafletSlider/index.html at master · dwilhelm89/LeafletSlider. Loading JSON with date/time · Issue #64 · socib/Leaflet.TimeDimension. Des cartes sur votre site. Vous avez peut-être déjà eu à afficher des cartes géographiques sur un de vos sites web ?
Vous auriez bien aimé vous passer d'un service privateur comme Google Maps ? Et bien la réponse est ici, avec la bibliothèque OpenSource Leaflet et les fonds de cartes OpenStreetMap. Si vous préférez les solutions Googlesques, n'hésitez pas à aller lire cet autre tuto sur l'API Google Maps. Quelques mots sur Leaflet et OpenStreetMap Commencons par voir ce que sont Leaflet et OpenStreetMap, afin que nous ayons un vocabulaire commun. OpenStreetMap OpenStreetMap (que j'abrégerais dorénavant OSM) est un fournisseur de fonds de carte. OSM se distingue cependant de ces différents organismes par sa démarche. Tout comme Zeste de Savoir, OSM est géré par un organisme à but non lucratif. Si vous voulez essayer, rendez-vous sur Quelques projets utilisant OSM. Leaflet et browserify: améliorez vos pratiques de développement. Depuis quelques temps déjà nous regardons l'activité assez hallucinante en terme de production de code de la société MapBox (qui fait un produit éponyme MapBox.JS basé sur Leaflet).
Nous avons constaté qu'ils s'inspiraient beaucoup d'outils venant du monde de Node JS, qui permet du développement JavaScript côté serveur. Ce développement de Node JS s'est accompagné de nouveaux outils qui permettent d'améliorer son processus de travail pour le développement d'interfaces cartographiques dans le navigateur. GitHub - socib/Leaflet.TimeDimension: Add time dimension capabilities on a Leaflet map. Animated line drawing in SVG - JakeArchibald.com. Posted 29 July 2013 using tired fingers There's a demo you're missing here because JavaScript or inline SVG isn't available.
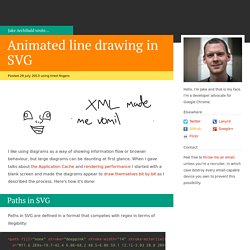
I like using diagrams as a way of showing information flow or browser behaviour, but large diagrams can be daunting at first glance. When I gave talks about the Application Cache and rendering performance I started with a blank screen and made the diagrams appear to draw themselves bit by bit as I described the process. Here's how it's done: Paths in SVG Paths in SVG are defined in a format that competes with regex in terms of illegibility: I use Inkscape to create the non-human-readable bits of SVG. Each part of the d attribute is telling the renderer to move to a particular point, start a line, draw a Bézier curve to another point, etc etc. The prospect of animating this data so the line progressively draws is, well, terrifying.
Specification. 1.
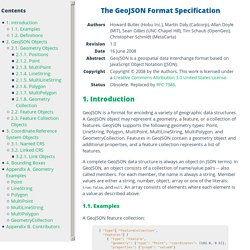
Introduction GeoJSON is a format for encoding a variety of geographic data structures. A GeoJSON object may represent a geometry, a feature, or a collection of features. GeoJSON supports the following geometry types: Point, LineString, Polygon, MultiPoint, MultiLineString, MultiPolygon, and GeometryCollection. Specification. 1.
Introduction GeoJSON is a format for encoding a variety of geographic data structures. A GeoJSON object may represent a geometry, a feature, or a collection of features. GeoJSON supports the following geometry types: Point, LineString, Polygon, MultiPoint, MultiLineString, MultiPolygon, and GeometryCollection. GitHub - hallahan/LeafletPlayback: This is a Leaflet plug-in that plays back points that have a time stamp synchronized to a clock. A Leaflet map with Node.js and MongoDB – denelius. Based on a number of comments, and the level of interest, I have updated this tutorial which I originally posted in 2014 addressing items, including, amongst other things, removing Mapbox libraries and updating the template engine from jade to pug.
Please get in touch via email or comments if you have any feedback. I wanted to explore the Node.js environment with a view to building a very simple mapping application. Initial searches didn’t reveal too much in the way of Leaflet, Node.js and MongoDB examples other than the OpenShift plug example by Steve Pousty back in 2014, which is a great start but I wanted a few more layers and an excuse to use the pug template engine (formerly jade). I attended an informative workshop by Steve Pousty at the 2014 FOSS4G event in Portland OR, same bundle, but with Flask rather than Node.js. I would highly recommend anyone starting out to spend some time on researching the fundamentals – here are a few links I found useful. Installation. Leaflet Time Slider Example. Gmail - Free Storage and Email from Google.
Leaflet et browserify: améliorez vos pratiques de développement. Leaflet TimeDimension. #5DLDN - Webatvantage. Leaflet - a JavaScript library for interactive maps. Mapbox : utilisé par de nombreux grands noms du Web : Cartographie : 6 alternatives Open Source à Google Maps et ses API. Socib/Leaflet.TimeDimension. A tutorial on visualizing bird tracking data with CartoDB - LifeWatch INBO. We have been using CartoDB for bird tracking data for a while now and are very happy to see that we have inspired others to do the same, including for other species.
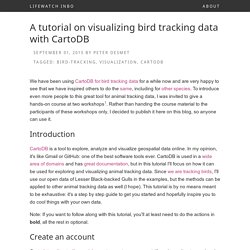
To introduce even more people to this great tool for animal tracking data, I was invited to give a hands-on course at two workshops. Rather than handing the course material to the participants of these workshops only, I decided to publish it here on this blog, so anyone can use it. Introduction CartoDB is a tool to explore, analyze and visualize geospatial data online. In my opinion, it's like Gmail or GitHub: one of the best software tools ever. Note: If you want to follow along with this tutorial, you'll at least need to do the actions in bold, all the rest in optional.
Create an account Go to to create an account, if you haven't got one already. Login Once logged in, you see your private dashboard. Upload data For this tutorial, well use our open bird tracking data. Data view Create your first map. CARTO Documentation — CARTO Documentation. uMap. Ol3-geocoder/package.json at master · jonataswalker/ol3-geocoder. Ol. OpenLayers as ES2015 modules.
Note: This package is in beta and the API is subject to change before a final stable release. Usage Add the ol package as a dependency to your project. npm install ol --save Import just what you need for your application: OpenLayers + Webpack. GitHub - webgeodatavore/demo_browserify_webpack_ol3: Demo to learn to use OpenLayers 3 with Browserify or WebPack. Create a New Pen. Marker Animation.