
1.3.13 - animated draggable connectors demonstration - jQuery. How to Create an Interactive Graph using CSS3 & jQuery. Topic: jQuery (Flot) & CSS3Difficulty: AdvancedEstimated Completion Time: 1 hour In this tutorial we will code an Interactive Graph using jQuery and CSS3.
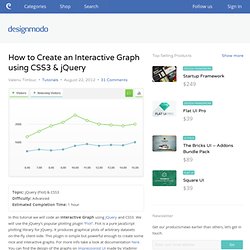
We will use the jQuery’s popular plotting plugin “Flot”. Flot is a pure JavaScript plotting library for jQuery. It produces graphical plots of arbitrary datasets on-the-fly client-side. This plugin is simple but powerful enough to create some nice and interactive graphs. Step 1 – HTML Markup To start we will create our html markup for the graph. Step 2 – jQuery and Flot Plugin Let’s include the JavaScript now. Step 3 – Graph Data The data of a graph is an array with data series (ex: [series1, series2, … ]). Step 4 – Load Graphs Now we will load the two graphs, the one with lines and the one with bars. Step 5 – Graph Container Styles First of all we will add some reset styles to clear the browser defaults.
Second of all we’ll add the gradient and the rounded corners. Step 6 – Graph Legend & Buttons. Mapper.js (automatic area highlighting for image maps) <form name="lst" id="lst" method="post" action="..
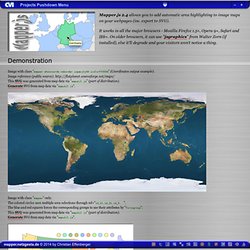
<div id="guru" title="By this you can recognize the Amiga fan! "><div><strong>Guru Meditation</strong> - With deactivated JavaScript: Images stay unmodified! </div></div> mapper.js 2.4 allows you to add automatic area highlighting to image maps on your webpages (inc. export to SVG). It works in all the major browsers - Mozilla Firefox 1.5+, Opera 9+, Safari and IE6+. Demonstration Image with class "mapper showcoords noborder iopacity50 icolorff0000" (Coordinates output example).Image reference (public source): This SVG was generated from map data via "maputil.js" (part of distribution).Generate SVG from map data via "maputil.js". Image with class "mapper" only. Congratulations, Mr. Image with class "mapper iborder00aa00 icolor00ff00".
Image with class "mapper noborder iradius16 iopacity50 icolorff0000". Images used are copyrighted and are used for demonstration only (use the shape data). Setting Up Using It. Js-mindmap demo - JavaScript Mindmap. D3.js - Data-Driven Documents. Indented Tree (Collapsible) Kennethkufluk/js-mindmap. Gallery · mbostock/d3 Wiki. Wiki ▸ Gallery Welcome to the D3 gallery!

More examples are available for forking on Observable; see D3’s profile and the visualization collection. Please share your work on Observable, or tweet us a link! Visual Index Basic Charts Techniques, Interaction & Animation Maps Statistics Examples Collections The New York Times visualizations Jerome Cukier Jason Davies Jim Vallandingham Institute for Health Metrics and Evaluation Peter Cook Charts and Chart Components Bar Chart Histogram Pareto Chart Line and Area Chart Pie Chart Scatterplot and Bubble chart Parallel Coordinates, Parallel sets and Sankey Sunburst and Partition layout Force Layout Tree Misc Trees and Graphs Chord Layout (Circular Network) Maps Misc Charts Miscellaneous visualizations Charts using the reusable API Useful snippets Tools Interoperability Online Editors Products Store Apps Presentation Next: A Windows 8 HTML5/SVG Presentation Builder Libraries Games Insanity is an D3js based online game developed to train people's reaction time and awareness.
Wish List. Introduction to Using Visualizations - Google Chart Tools / Inte. Google Charts provides a perfect way to visualize data on your website.
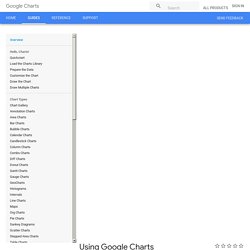
From simple line charts to complex hierarchical tree maps, the chart gallery provides a large number of ready-to-use chart types. The most common way to use Google Charts is with simple JavaScript that you embed in your web page. You load some Google Chart libraries, list the data to be charted, select options to customize your chart, and finally create a chart object with an id that you choose. Then, later in the web page, you create a <div> with that id to display the Google Chart. That's all you need to get started. Charts are exposed as JavaScript classes, and Google Charts provides many chart types for you to use. All chart types are populated with data using the DataTable class, making it easy to switch between chart types as you experiment to find the ideal appearance.