The Next Era of Designers Will Use Data as Their Medium. The software industry today is in need of a new kind of designer: one proficient in the meaning, form, movement, and transformation of data.
I believe this Data Designer will turn out to be the most important new creative role of the next five years. When I began my career 25 years ago, the notion of design in the software industry was still nascent. It was an engineer’s world, in which just making software function was the consuming focus. So the qualification for this design role was quite simple: do you know anything about software? Those of us trying to apply humanistic or artistic notions to the process faced fundamental technical challenges. Mark Rolston About Mark Rolston is the cofounder and chief creative officer of argodesign. Postarchitectural: sha hwang.
Experimental Cartography: The Map as Art. By Maria Popova What tattoo art has to do with fashion, vintage atlases and Nazi concentration camps.
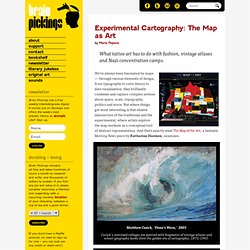
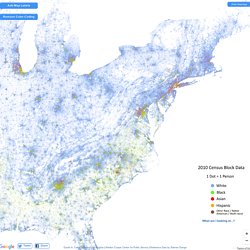
The Racial Dot Map: One Dot Per Person for the Entire U.S. Terms of Use Add Map Labels Remove Color-Coding Hide Overlays What am I looking at...?
Tweet. Video: visualisation of Foursquare check-ins reveals the pulse of London life. Here’s a sweet piece of data visualisation eye candy; Foursquare has mapped a day in the life of London, collating check-ins from across 2013.
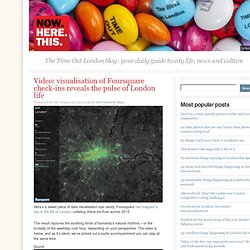
The result captures the soothing throb of humanity’s natural rhythms – or the brutality of the weekday rush hour, depending on your perspective. The video is below; and as it’s silent, we’ve picked out a audio accompaniment you can play at the same time. Sound: Living Cities — HERE and CartoDB. La mappa della metro di Roma, come la vorrebbero tutti i romani. Trend 9: The Revival Of Psychogeography. Psychogeography is hot.
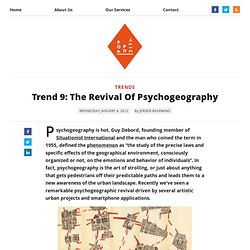
Guy Debord, founding member of Situationist International and the man who coined the term in 1955, defined the phenomenon as “the study of the precise laws and specific effects of the geographical environment, consciously organized or not, on the emotions and behavior of individuals”. In fact, psychogeography is the art of strolling, or just about anything that gets pedestrians off their predictable paths and leads them to a new awareness of the urban landscape. Recently we’ve seen a remarkable psychogeographic revival driven by several artistic urban projects and smartphone applications. Over the last years we’ve seen several psychogeograhy-oriented initiatives in the urban mapping world.
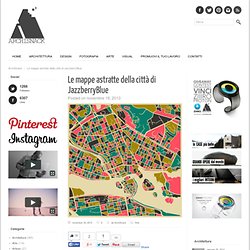
Lost London for instance, a project by interaction designer Emilie Giles that focuses on the forgotten places and networks that exist within the city of London. You Are Here –> Mapping the Psychogeography of New York City. Le mappe astratte della città di JazzberryBlue - ArchiSnack. Le mappe astratte della città di JazzberryBlue Le mappe astratte delle città più popolari del mondo.
Do Maps Create or Represent Reality? Kim Dingle, Maps of the U.S.
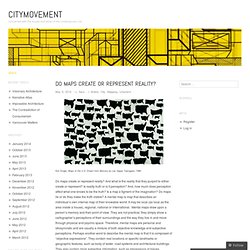
Drawn from Memory by Las Vegas Teenagers, 1990 Do maps create or represent reality? And what is the reality that they purport to either create or represent? Is reality truth or is it perception? Diagram Mapping. World map by Ranulf Higden, British Library Recently, in my ongoing researching of maps, I discovered that before the 15th century, the word “map” did not exist.
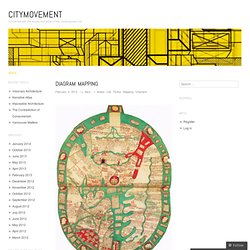
Instead, what today we consider to be maps were referred to in the centuries preceding the 15th, as “diagrams”. This makes a great deal of sense because cartographic accuracy was less important than the graphic depiction of spatial relationships between not only geographic features but between social, cultural and religious values and symbologies. During the Medieval period maps were produced to depict a particular event or occasion unlike our contemporary notion of a ‘generalised’ map of a territory. Mapping Lecture. Where You Are. 3Cs: Counter-Cartographies Collective. Counter-mapping. Counter-mapping refers to efforts to map "against dominant power structures, to further seemingly progressive goals".[1] The term was coined by Nancy Peluso[2] in 1995 to describe the commissioning of maps by forest users in Kalimantan, Indonesia, as a means of contesting state maps of forest areas that typically undermined indigenous interests.
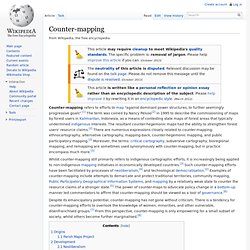
The resultant counter-hegemonic maps had the ability to strengthen forest users' resource claims.[2] There are numerous expressions closely related to counter-mapping: ethnocartography, alternative cartography, mapping-back, counter-hegemonic mapping, and public participatory mapping.[3] Moreover, the terms: critical cartography, subversive cartography, bioregional mapping, and remapping are sometimes used synonymously with counter-mapping, but in practice encompass much more.[3] Despite its emancipatory potential, counter-mapping has not gone without criticism. Origins[edit] Parish Maps Project[edit] Development[edit] Neoliberalism[edit] [edit] Mapping the 'Time Boundaries' of a City - Emily Badger.
Maps don't typically convey time very well.
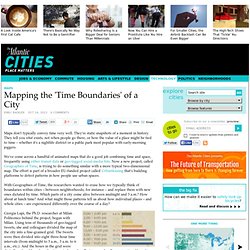
They're static snapshots of a moment in history. They tell you what exists, not when people go there, or how the value of a place might be tied to time – whether it's a nightlife district or a public park most popular with early-morning joggers. What Are We Still Mapping For? Installation view, “Contemporary Cartographies” at Lehmann College Art Gallery, with Charley Friedman’s “Carpet World/Carpet Moon” in the center (all photos by the author for Hyperallergic) When I was a kid, my father kept a dog-eared street map of the Dallas metroplex in his truck’s glove compartment. As a contractor who spent hours driving each day, this atlas was his North Star — a point of reference for navigating the city’s chaotic, concrete sprawl. Today, the cartographic tradition that his homely map belonged to — spanning millenniums from the early Phoenicians to Amerigo Vespucci and Lewis and Clark — is rapidly changing. I now find my way through New York by following a tiny, triangular point on an iPhone screen.
In an age of new technology, information, and globalization, maps are no longer mere objects, and they increasingly represent immaterial worlds. Paula Scher, “The United States (Red)” (2007), hand-pulled silkscreen on Coventry Rag, 40 x 60 in (click to enlarge) Maps That Will Change the Way You See the World. Where Google Street View is available. The supercontinent of Pangaea with modern day borders. The pink represents countries that the British have invaded.
Goddammit, Brittan! Countries that don't use metric. Goddammit, America! Most common surnames by country. Countries that offer maternity leave. Crisis mapping. Crisis mapping is the real-time gathering, display and analysis of data during a crisis, usually a natural disaster or social/political conflict (violence, elections, etc.).[1] Crisis mapping projects usually allows large numbers of people, including the public and crisis responders, to contribute information either remotely or from the site of the crisis. One benefit of the crisis mapping method over others is that it can increase situational awareness, since the public can report information and improve data management.[2] Crisis mappers work with data that comes from diverse sources and can be produced for varying purposes. As such, there is some overlap with big data,[3] international development,[4][5] and community engagement.[6] An example of a crisis map. History[edit] One of the first major events to utilize crisis mapping was the 2010 Haiti earthquake, which killed and injured hundreds of thousands of people and left homes and infrastructure badly damaged.
Collaborative Mapping, pratiche neogeografiche e nuove sfide alla governance urbana. Quando nel 2005 viene lanciato Google Map, improvvisamente, le nostre ricerche in web si ordinano sulla superficie terrestre, in quella piana raffigurazione del mondo rappresentata dalla figura della mappa geografica.Ma non solo. La possibilità di poter contribuire alla costruzione della mappa, nelle sue correzioni e nei contenuti, fa emergere un una pratica sperimentativa già attiva da qualche anno nel regno del web: il collaborative mapping si presenta come attività volontaria di neogeografi dello spazio urbano e di loro stessi. The Real-time Cultural Ecosystem of the City of Rome.
The Real-time Cultural Ecosystem of the City of Rome is a visualisation which captures all the interactions on social networks through which internet users discuss about the cultural life of their city. (it is the first part of the Human Ecosystems project) The heuristics of mapping urban environmental change. Mapping is not only a tool to investigate and capture place-making practices but is itself a means to produce spaces and social relations. Hence, as maps and territories co-construct one another, we ask to what extent can mapping, as a political tool, be a means to contest and re-shape the unjust distribution of resources and opportunities in cities?
How can mapping be appropriated by ordinary citizens in their place-making practices? What are the lessons and practical applications that can be drawn from its use in various disciplines? This research seeks to refine the conceptual and methodological approach vis a vis mapping and develop a heuristic path through an interdisciplinary dialogue.
Welcome to MAP-it. Informational landscapes. A Map Of Your City’s Invisible Neighborhoods, According To Foursquare. Every city is filled with different neighborhoods, but often, you won’t find these places on any map. They’re word-of-mouth zoning distinctions known only to locals. The boundaries are vague and arbitrary, based as much upon the way people eat and dress as real estate prices and income per capita. Yet if these areas are distinctive to city culture, is there a way that we could measure them and analyze them--map them--scientifically? A team of students (Justin Cranshaw, Raz Schwartz) and professors (Jason I. Hong and Norman Sadeh) from Carnegie Mellon’s Mobile Commerce Lab has done just that.